
 Facebook
 Twitter
 Pinterest
 Copy Link
Local Market Update – July 2020


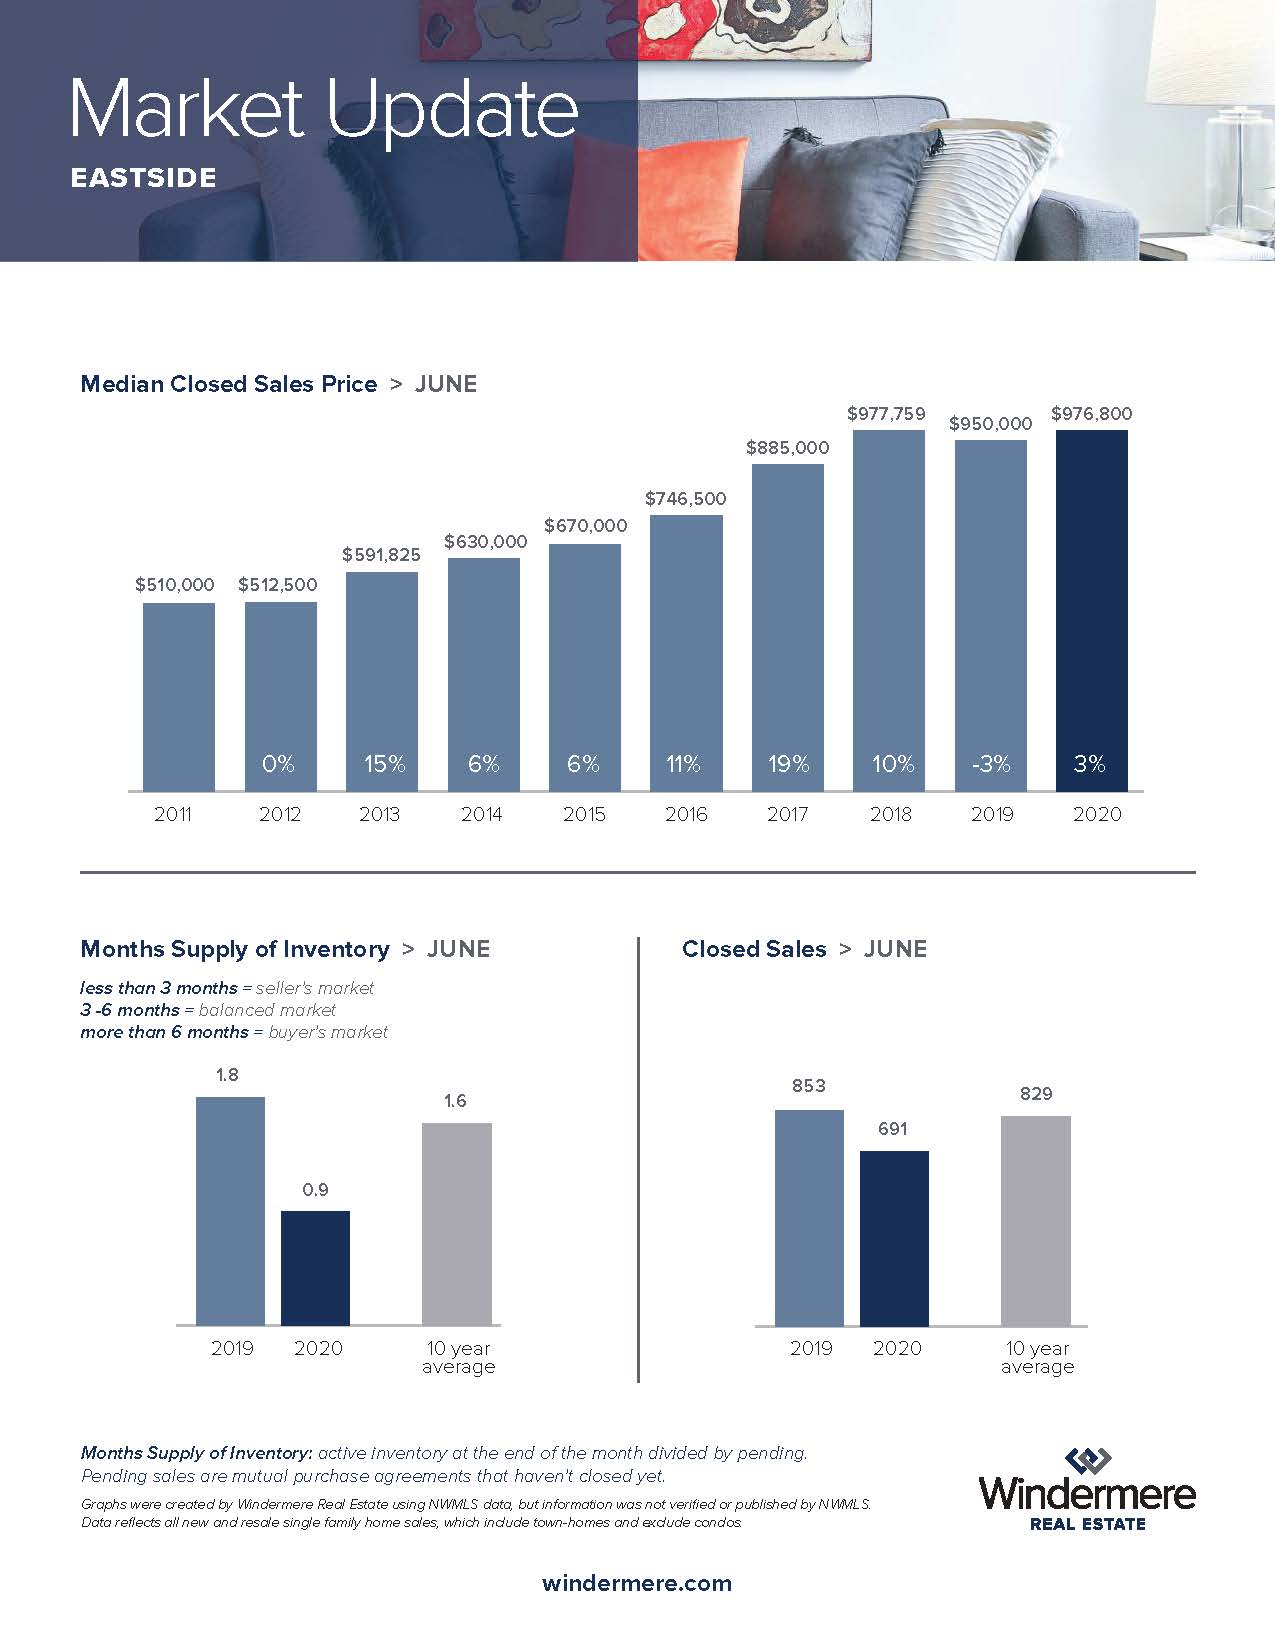
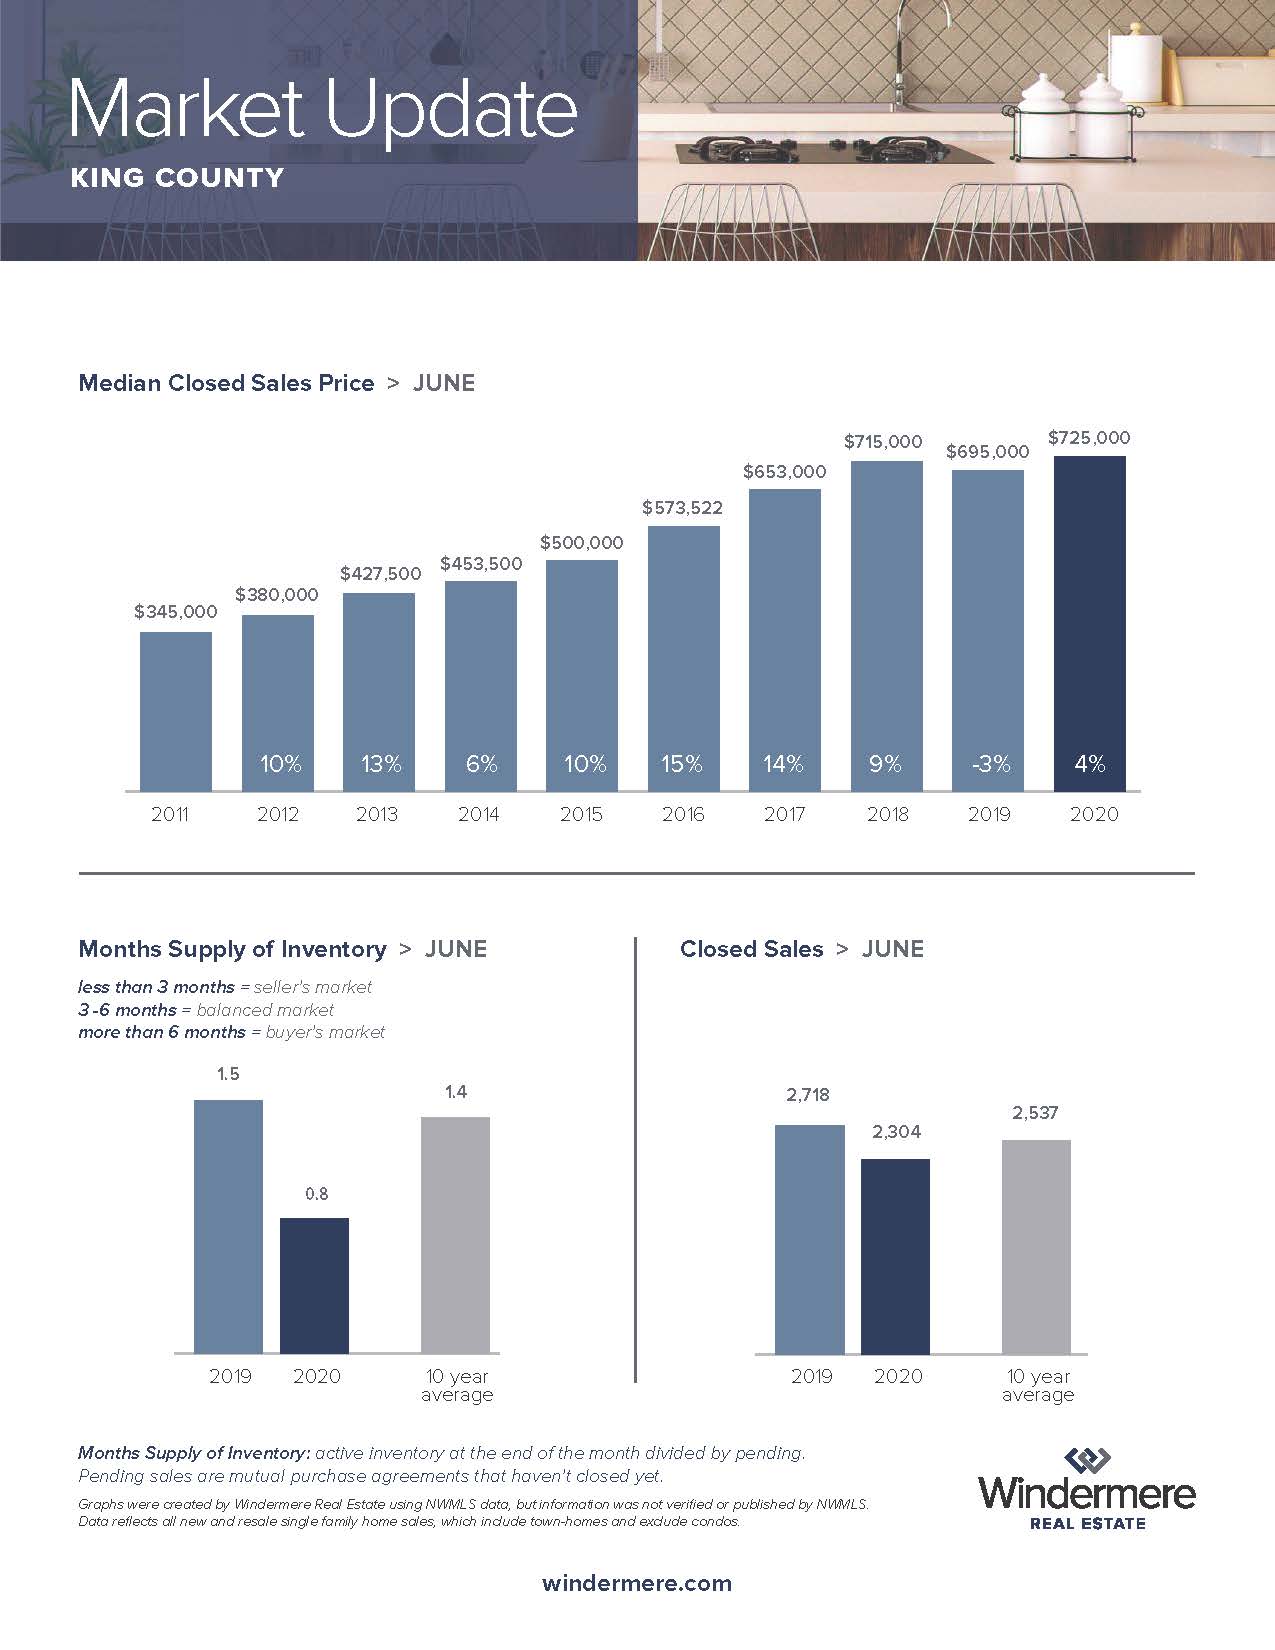
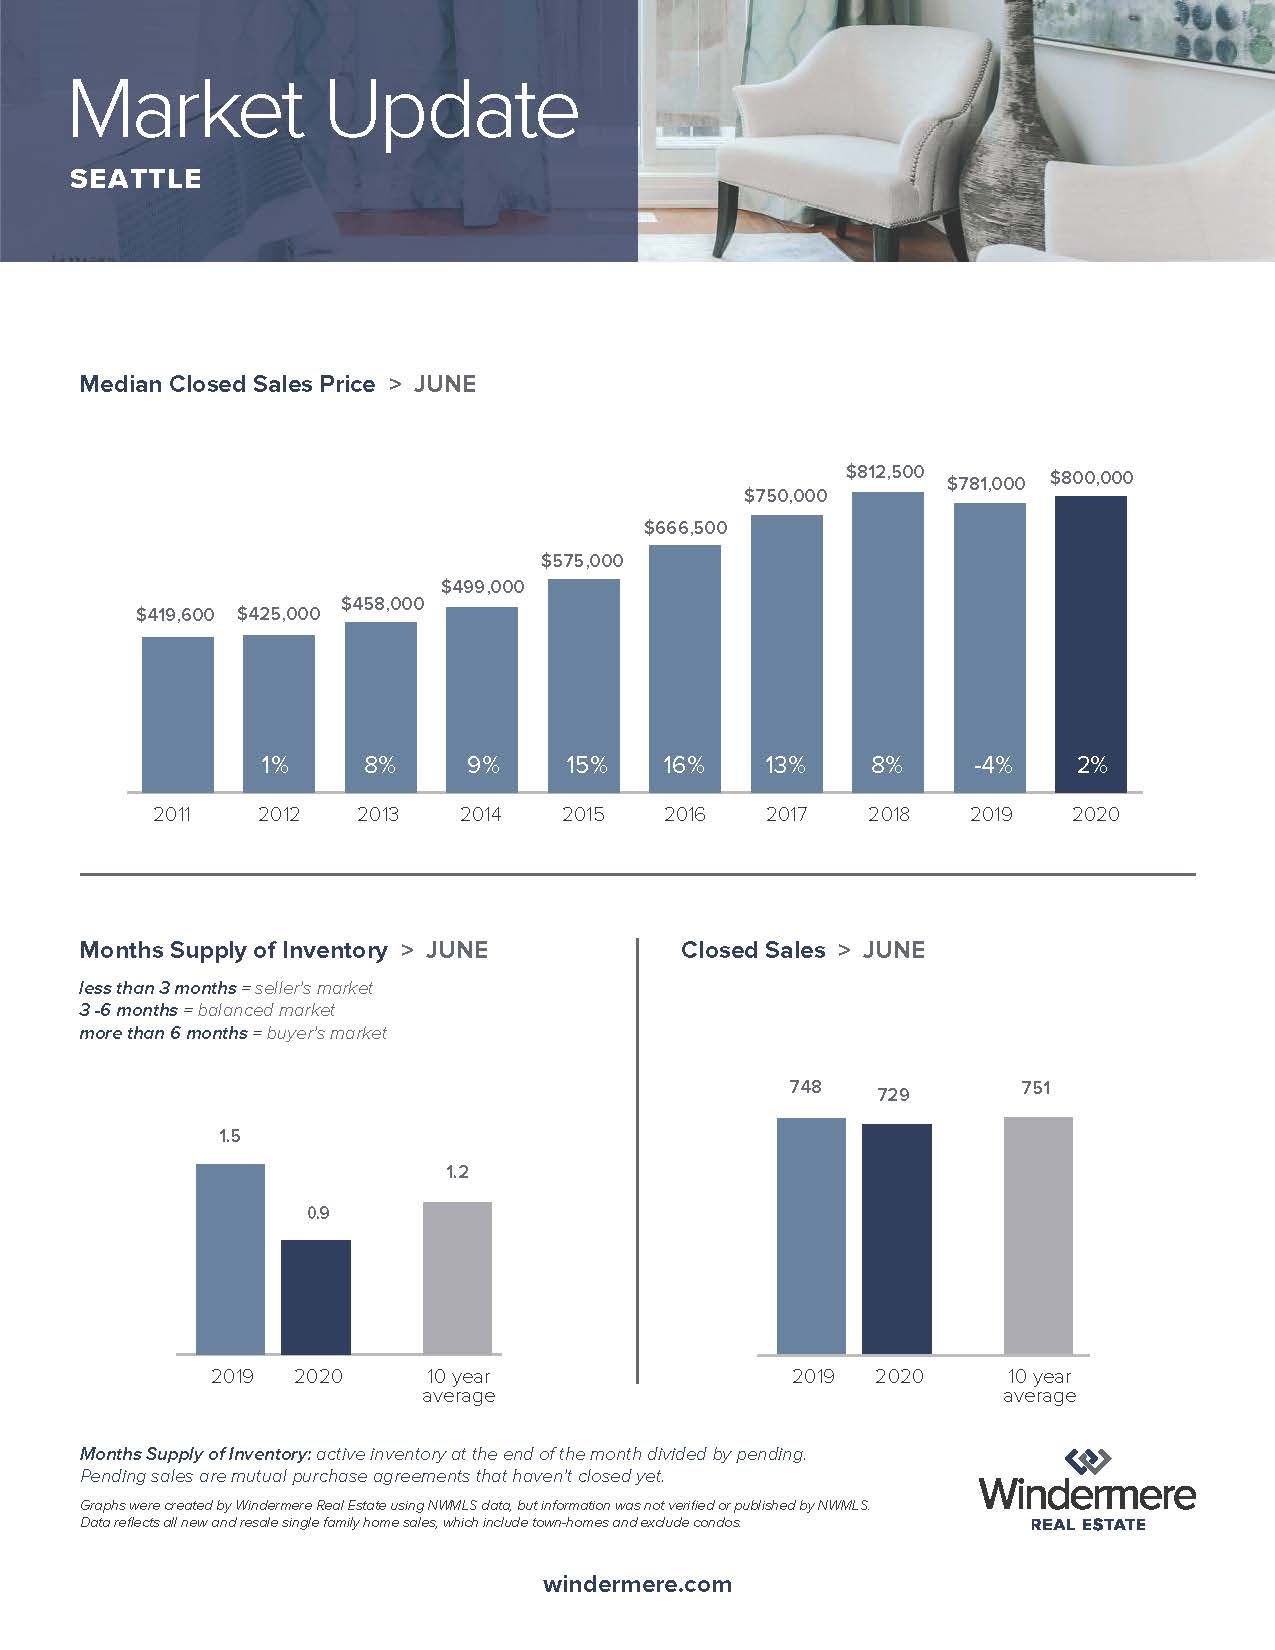
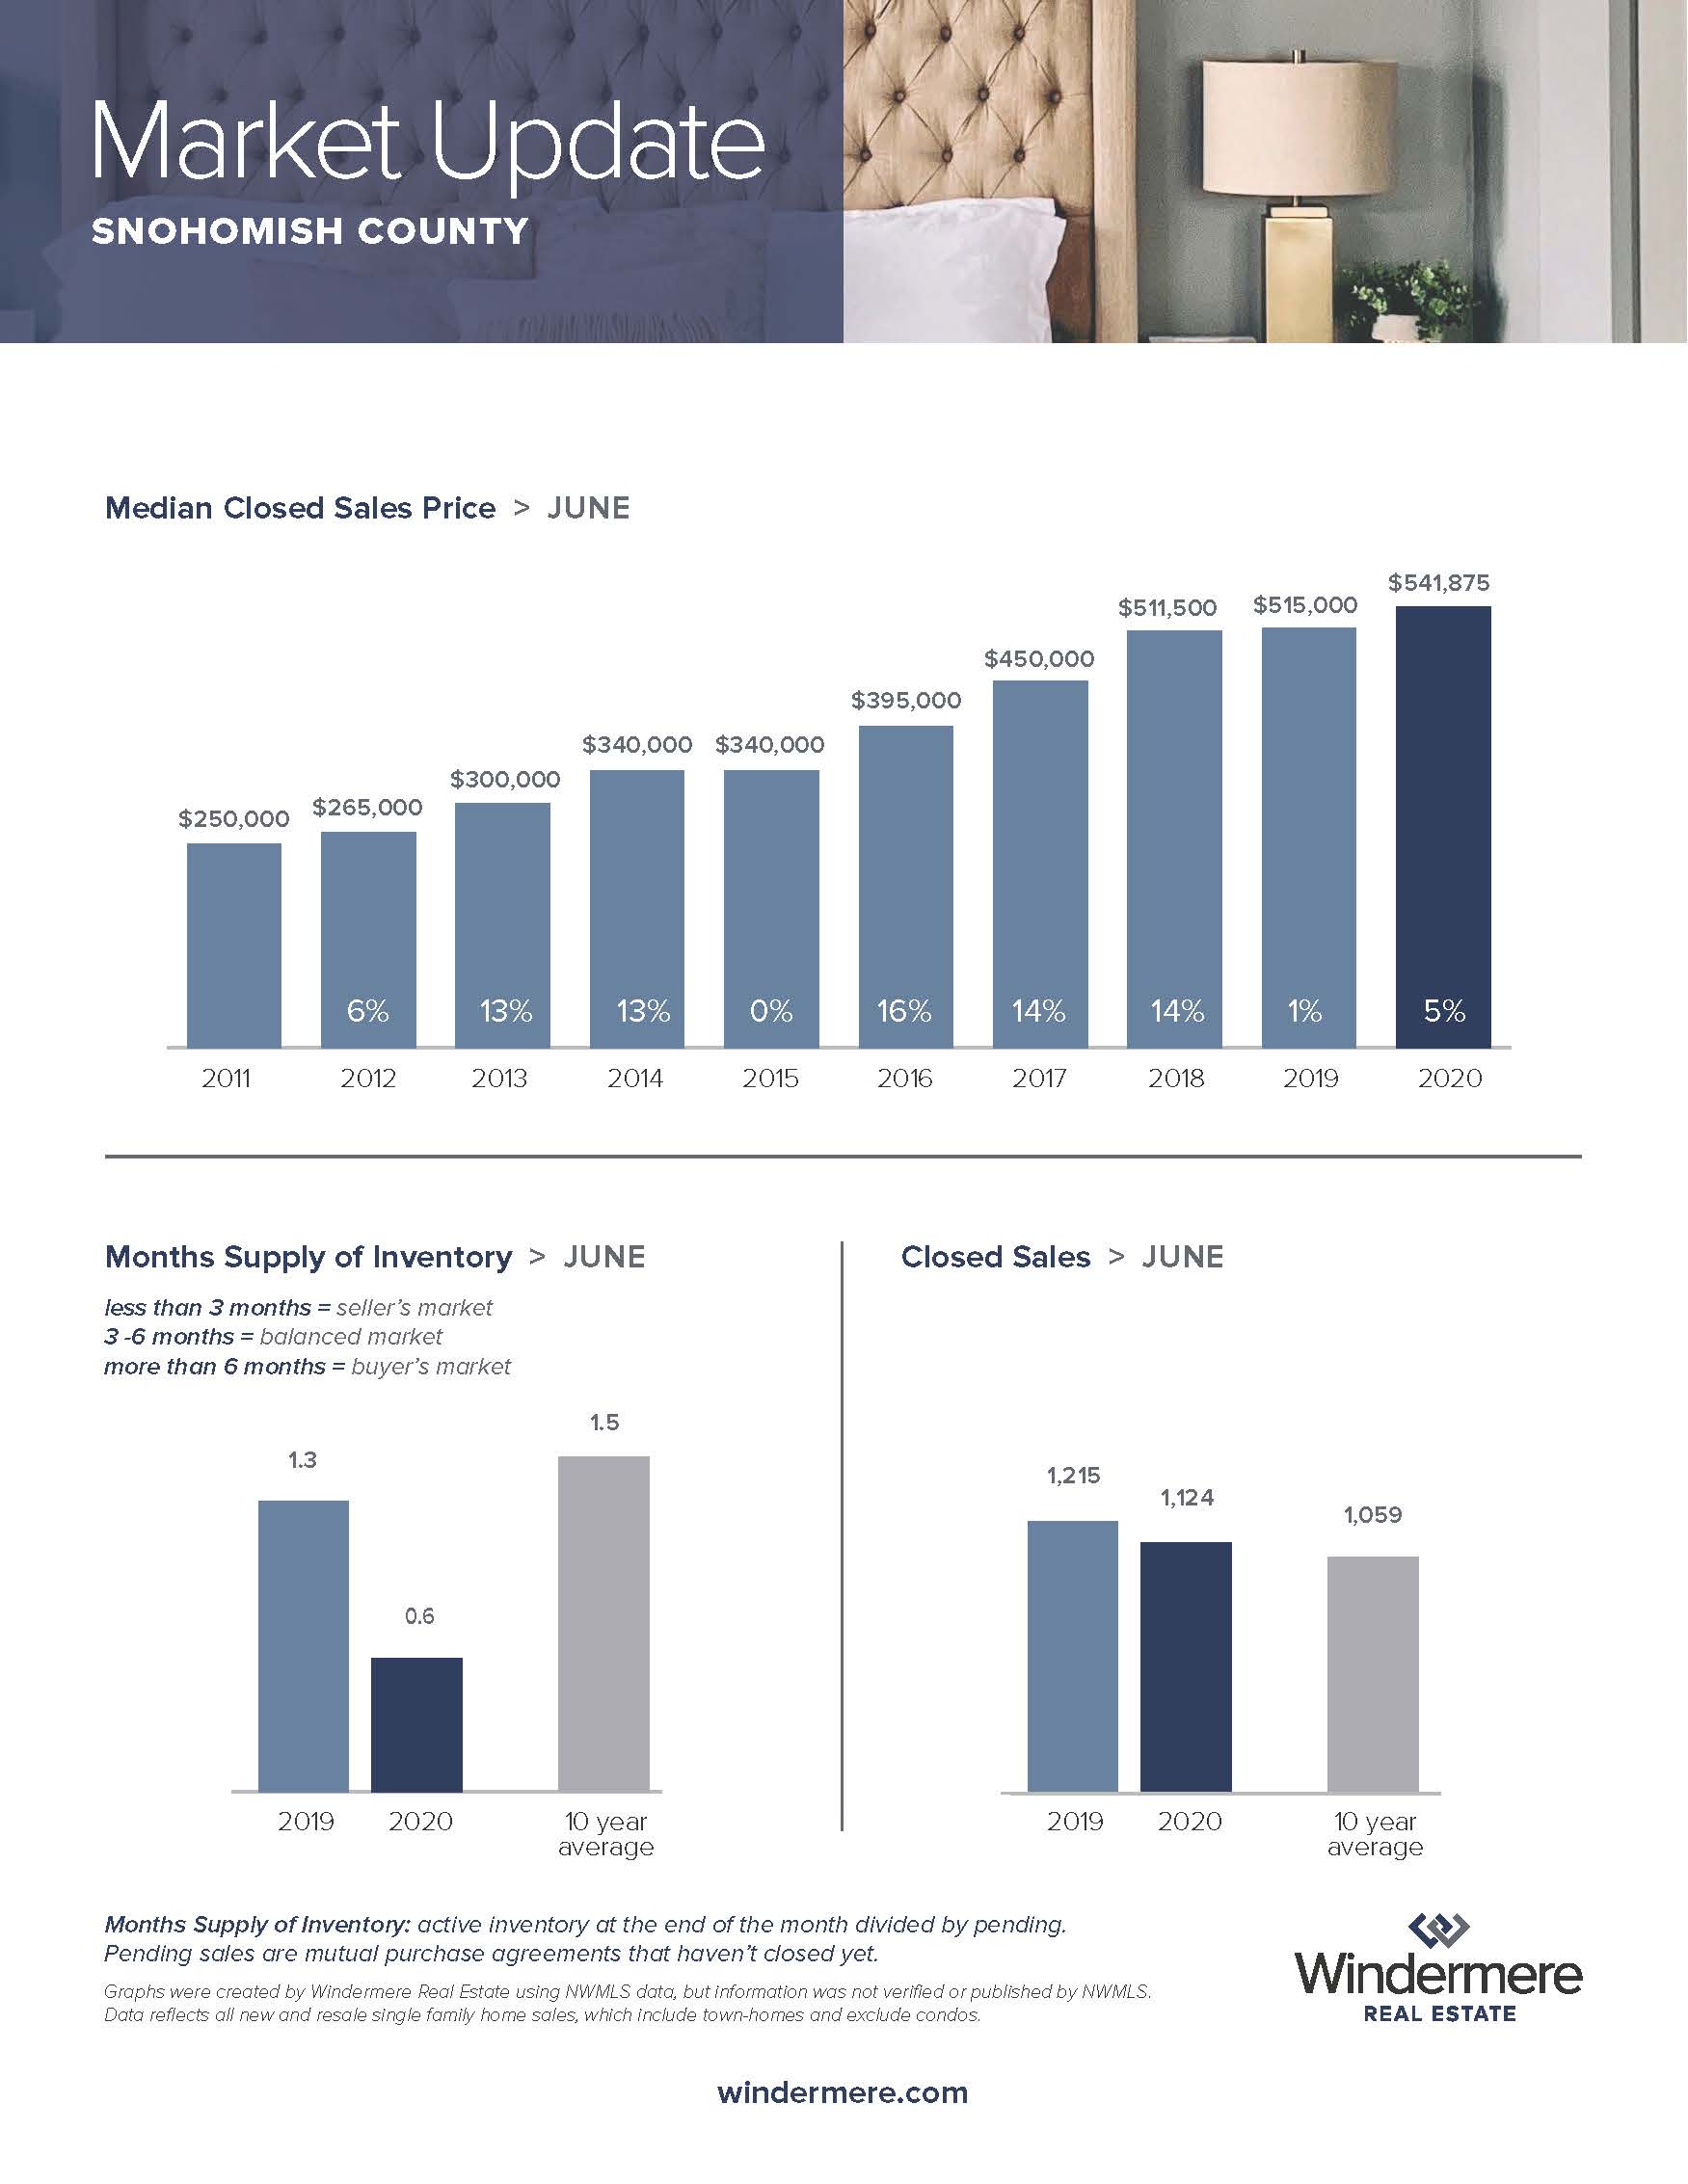
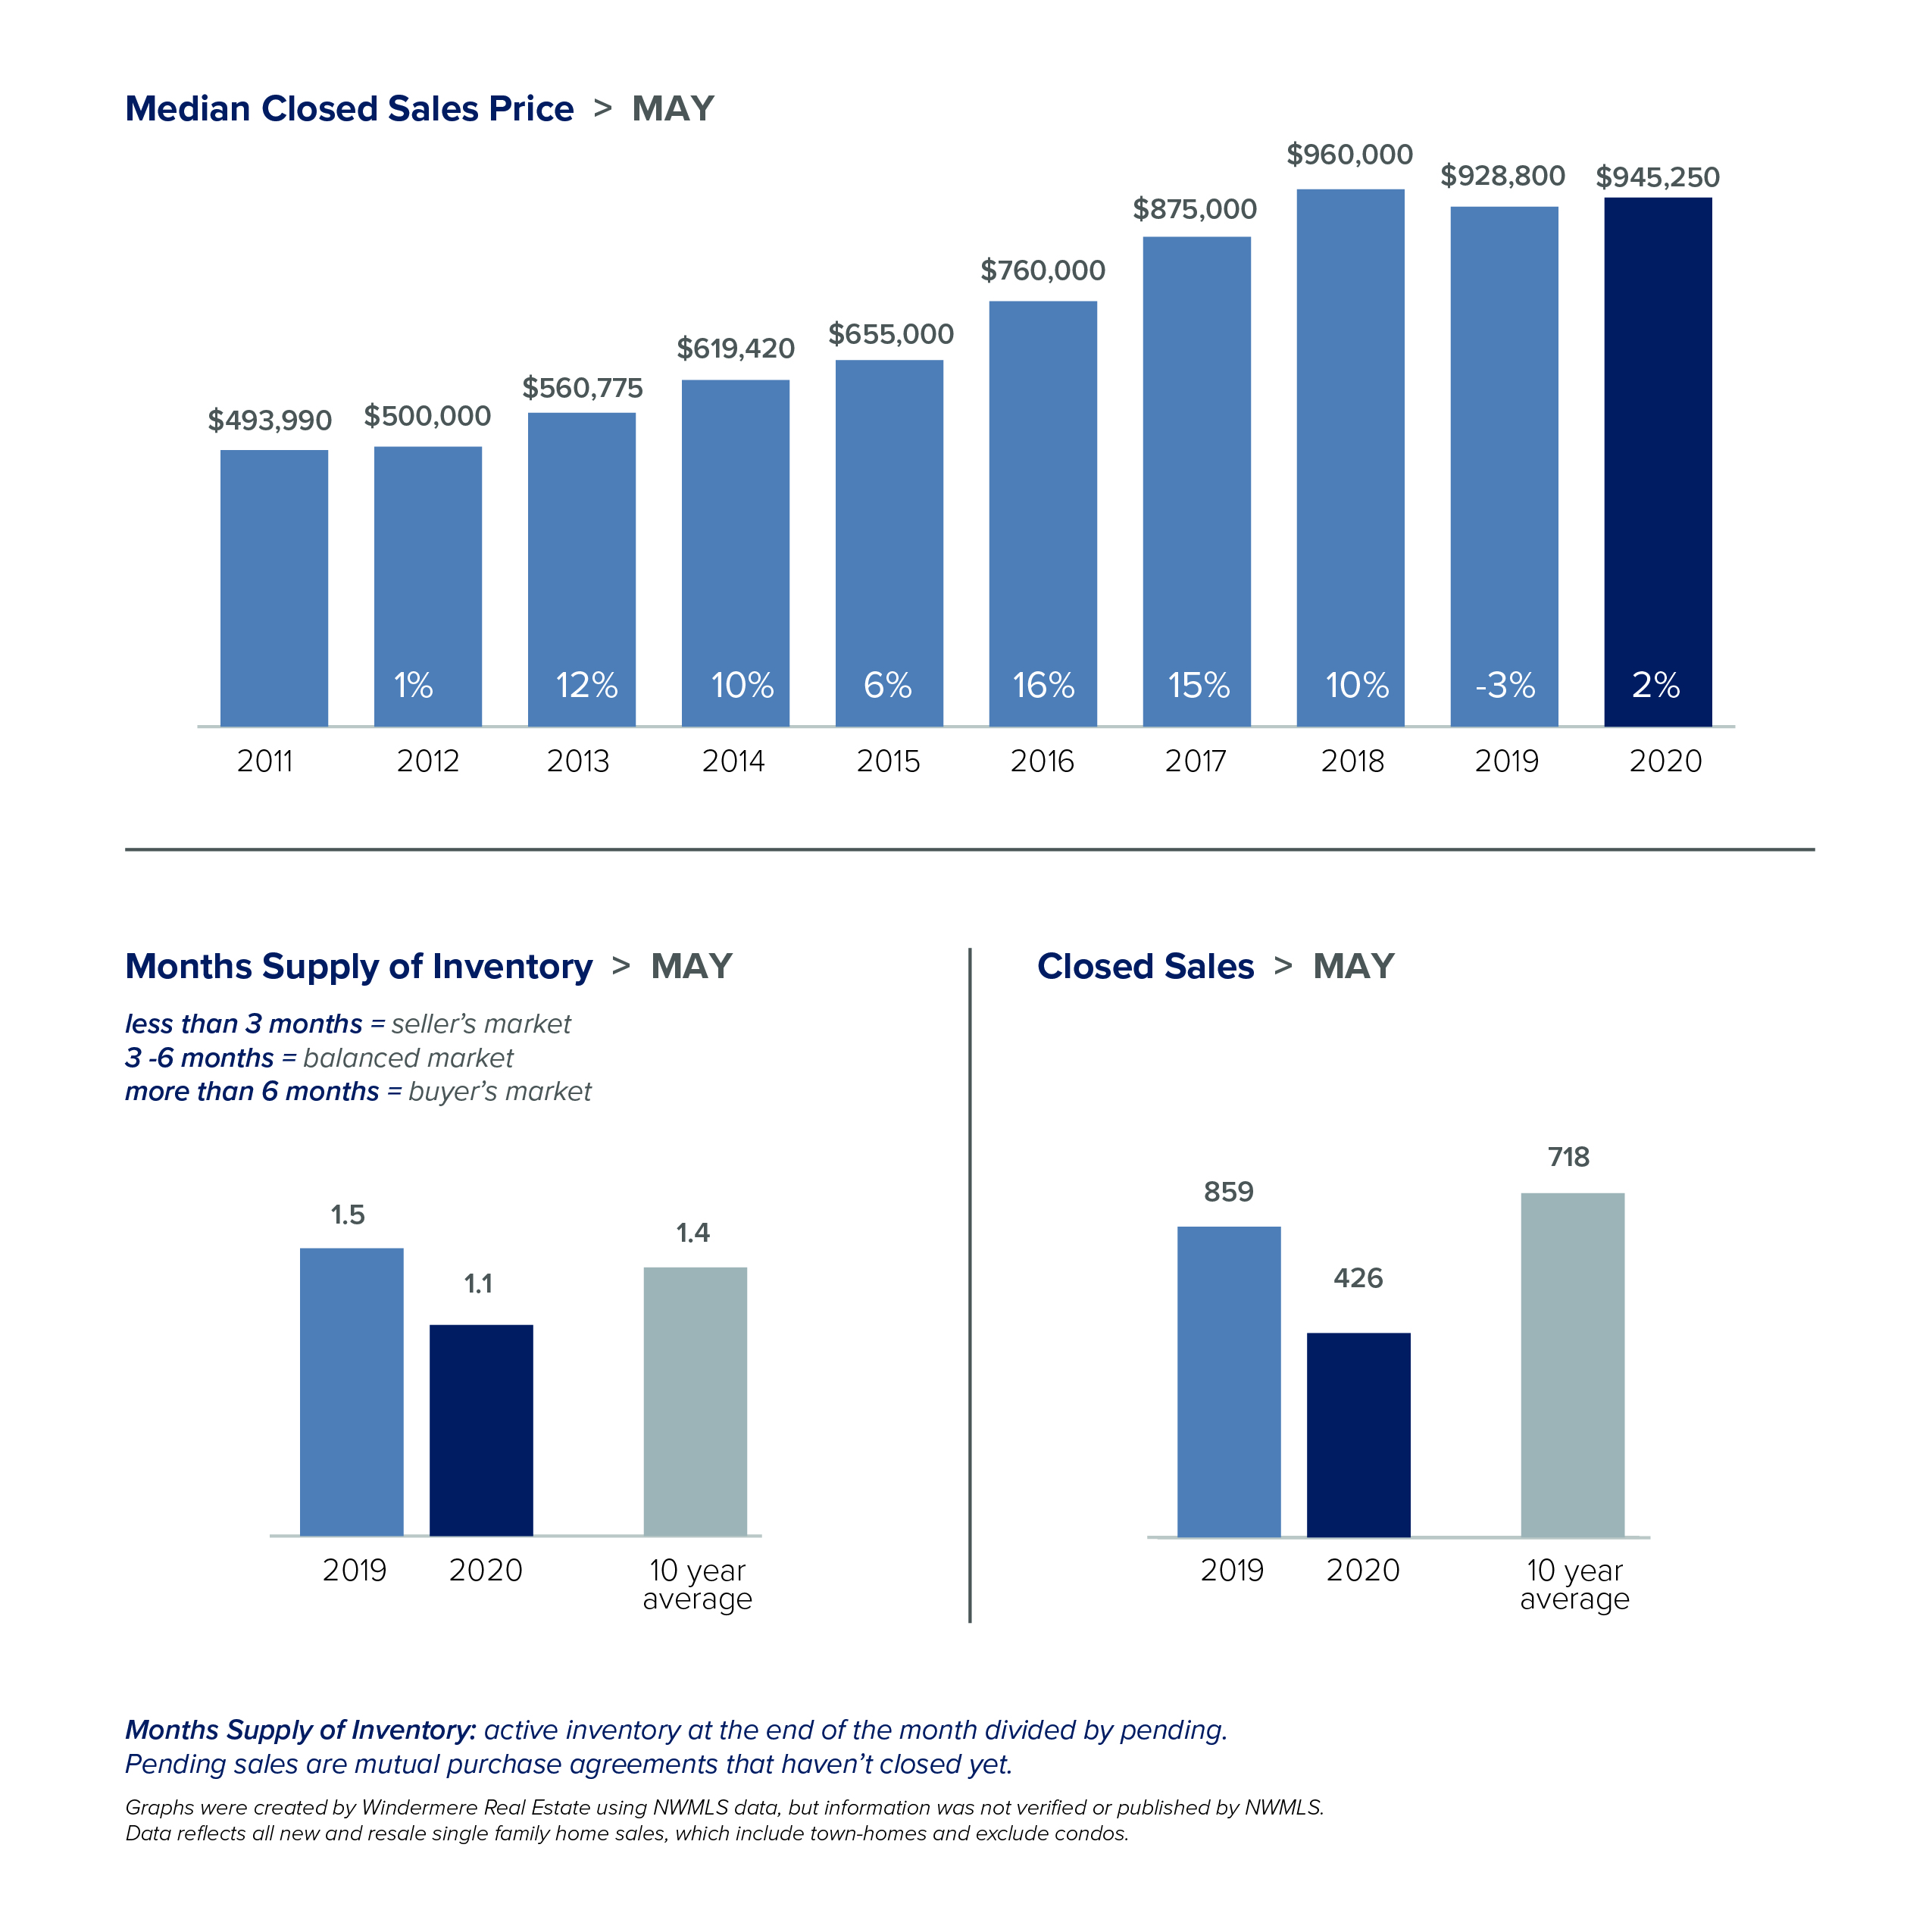
While our lives are very different than they were a year ago, the local real estate market has recovered to 2019 levels. Record low interest rates are helping spur demand. Sales were up, home prices increased and multiple offers were common.
- The number of pending sales, a measure of current demand, was higher in June than for the same period a year ago.
- The supply of homes on the market remains very low, with just a month of available inventory. When inventory is this low, quick sales over full price are common. That was the case in June when about 40% of homes sold for more than the asking price.
- Home prices in King County rose 4% over a year ago. Snohomish County home prices increased 5%.
- More sellers put their homes on the market. While total inventory remains low, the number of new listings in June was similar to the same time last year.
The monthly statistics below are based on closed sales. Since closing generally takes 30 days, the statistics for June are mostly reflective of sales in May. If you are interested in more information, every Monday Windermere Chief Economist Matthew Gardner provides an update regarding the impact of COVID-19 on the US economy and housing market. You can get Matthew’s latest update here.
EASTSIDE
KING COUNTY
SEATTLE
SNOHOMISH COUNTY
VIEW FULL SNOHOMISH COUNTY REPORT
This post originally appeared on GetTheWReport.com
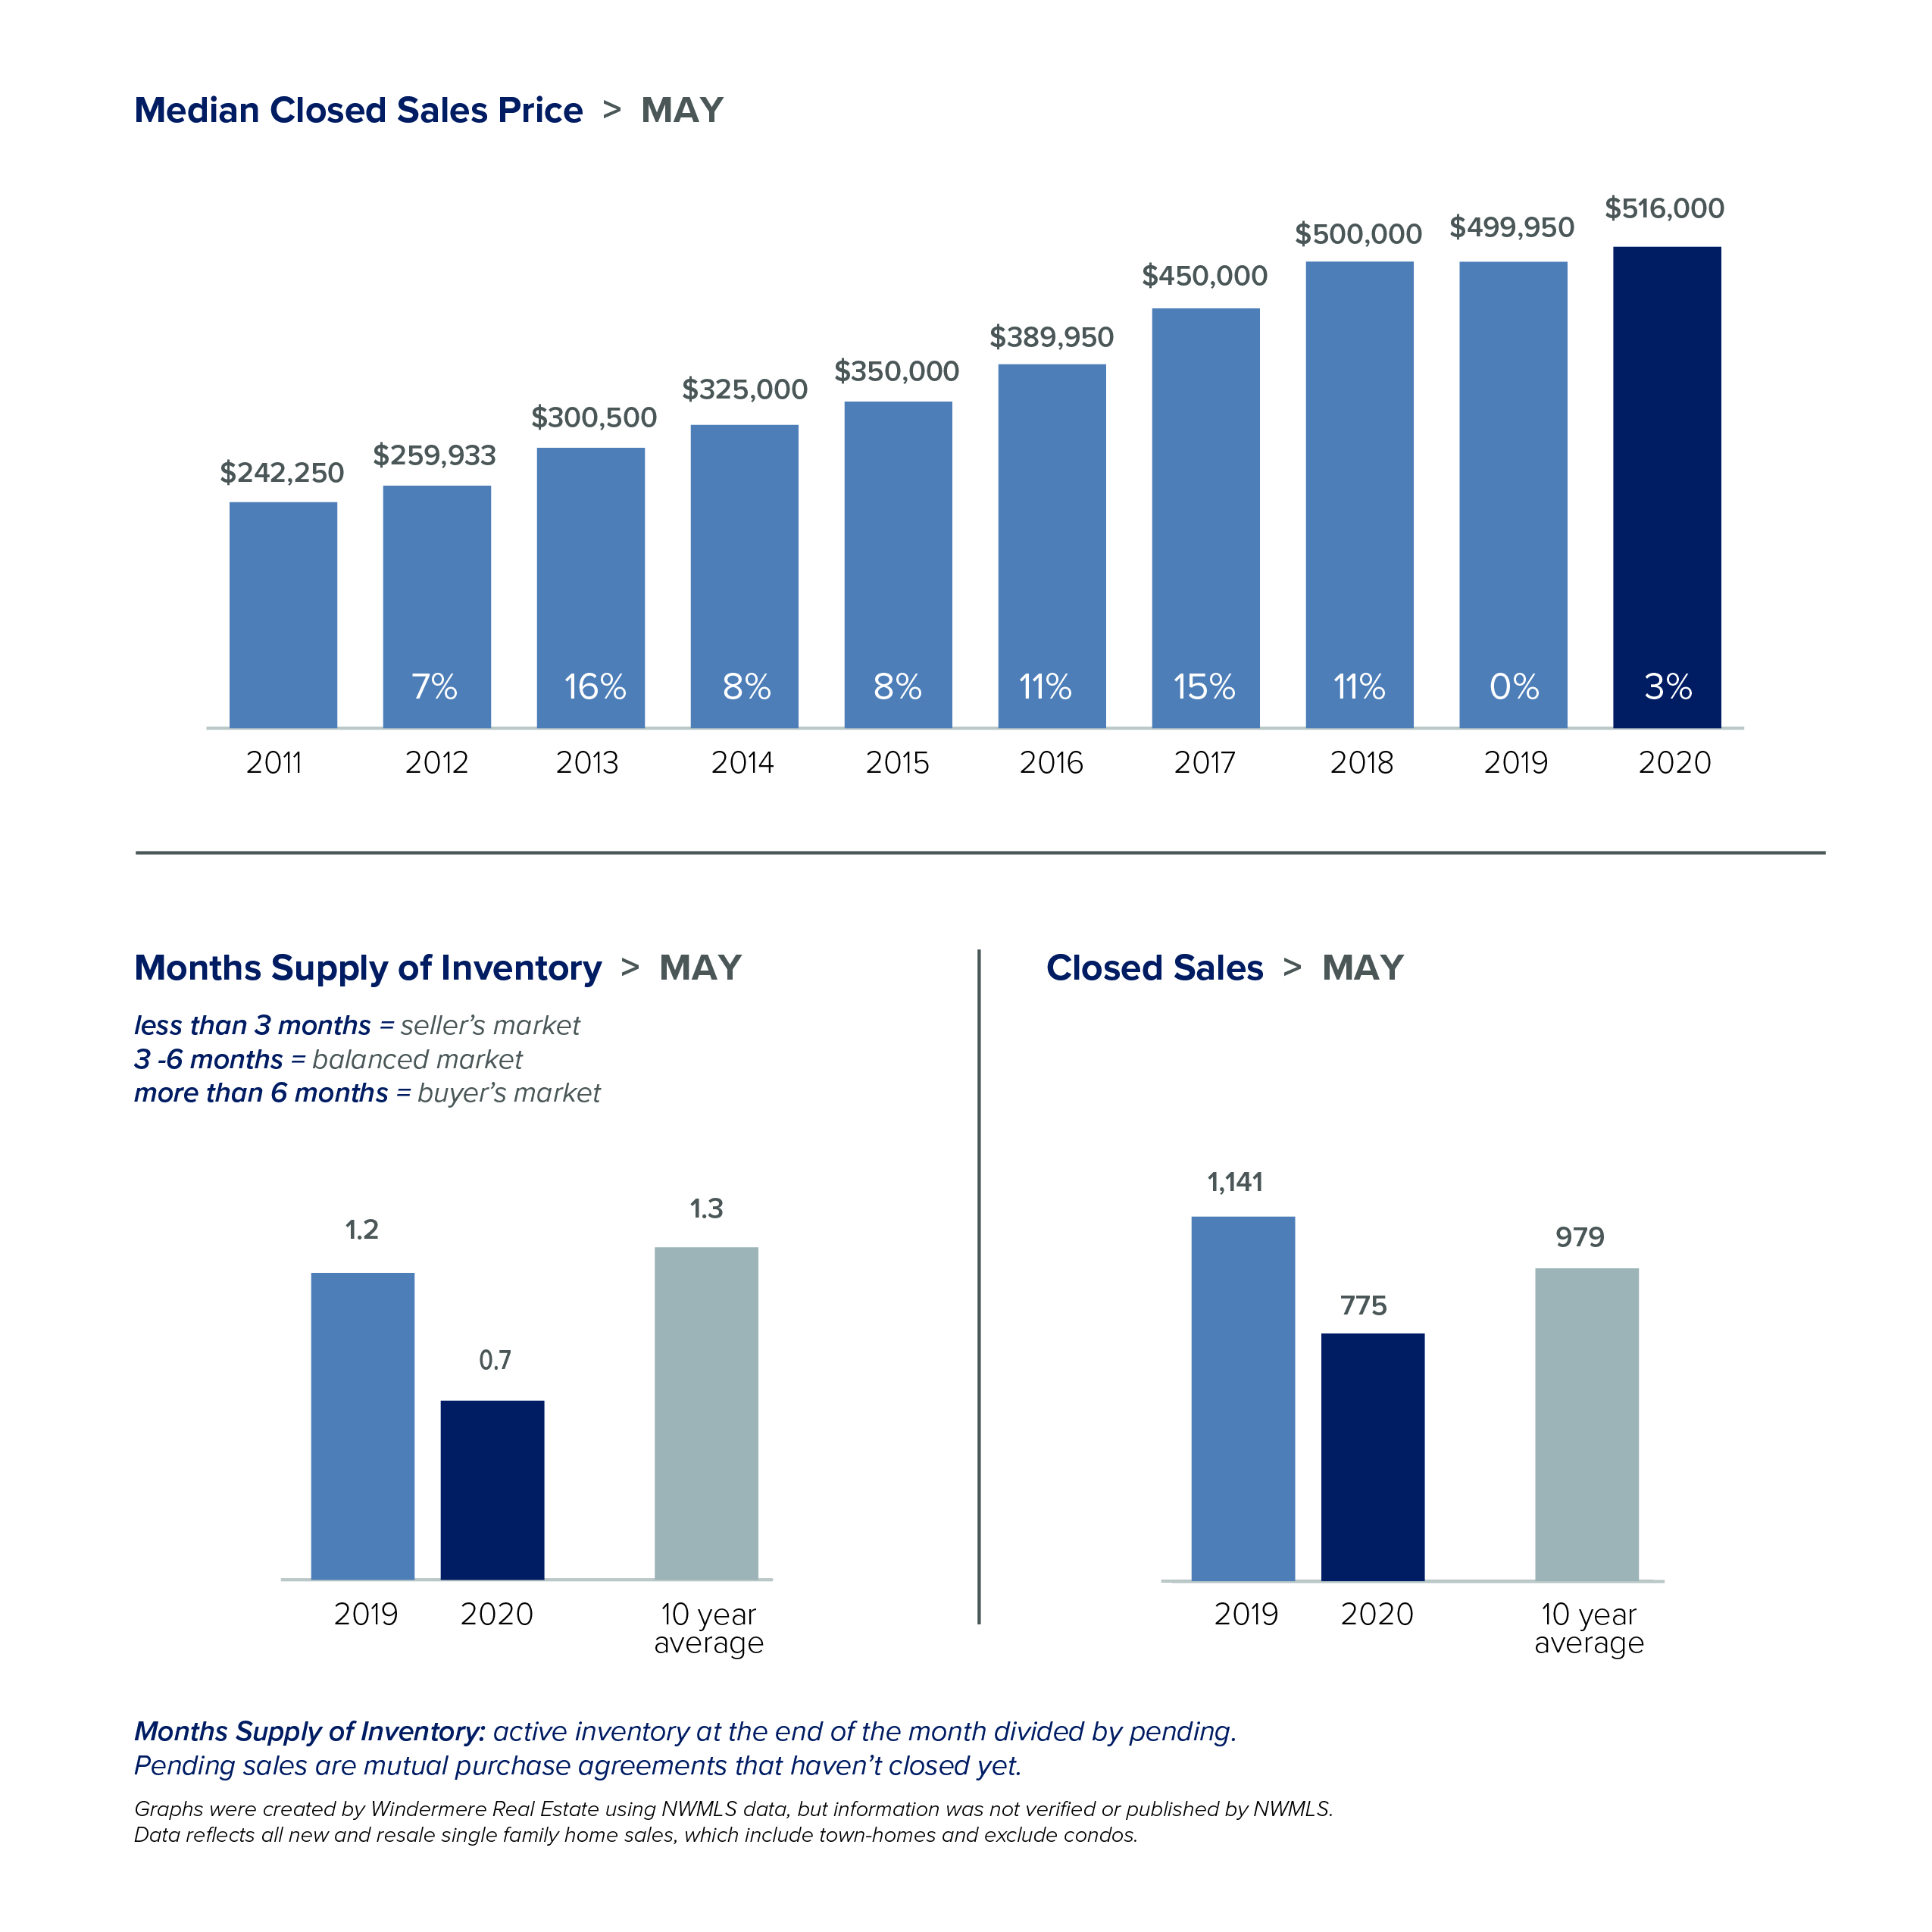
Local Market Update – June 2020

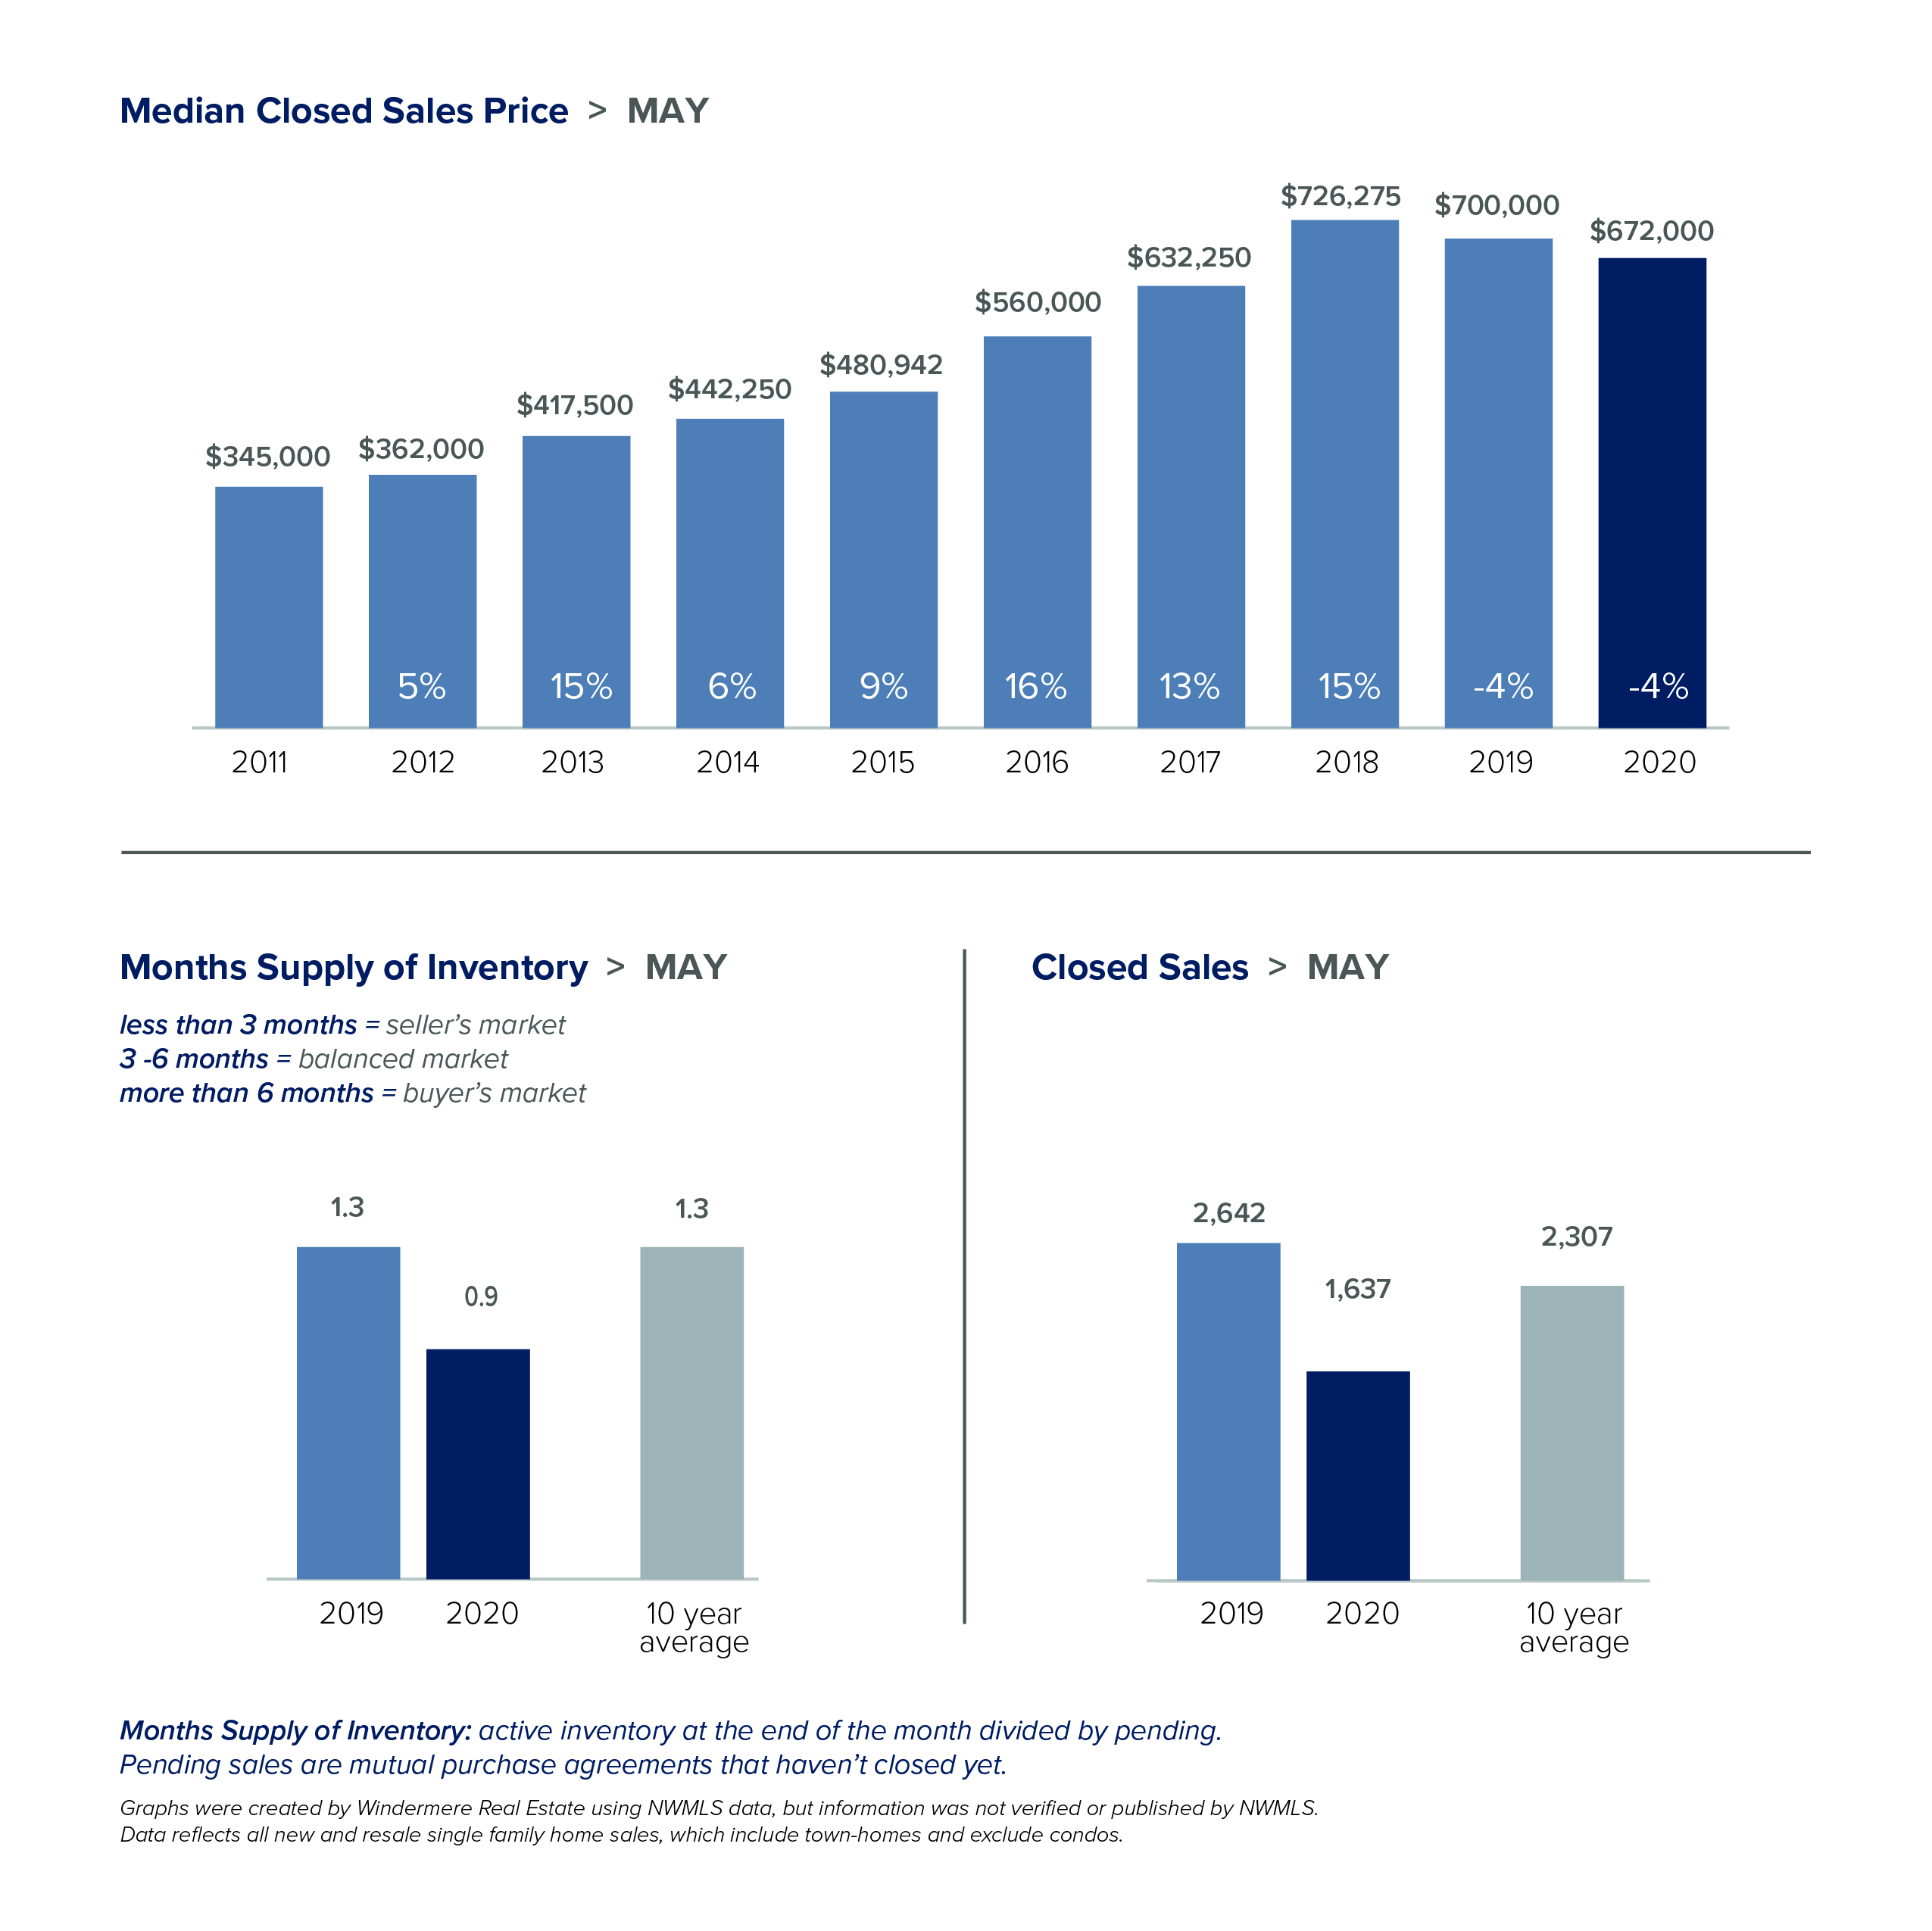
As we move to the next phase of reopening, life feels like it’s slowly inching back towards normal. The same is true in real estate. Statistics on home sales in May provided the first true picture of the effects of COVID-19. Those reports confirmed the incredible strength and stability of the local real estate market.
- The Stay Home order, as expected, continued to impact the number of sales. However, the market is starting to move its way towards more normal activity. Pending sales, a measure of current demand, have risen every week since April.
- The slight drop in median closed sale price is a result of a proportionately larger number of lower priced homes selling than is normal. It should not be interpreted as a decrease in individual home value.
- There were significantly fewer homes for sale in May than the same time last year. With less than a month of available inventory, competition among buyers was intense. Bidding wars and all-cash offers were common.
The monthly statistics below are based on closed sales. Since closing generally takes 30 days, the statistics for May are mostly reflective of sales in April. If you are interested in more information, every Monday Windermere Chief Economist Matthew Gardner provides an update regarding the impact of COVID-19 on the US economy and housing market. You can get Matthew’s latest update here. As we adapt to new phases of reopening, know that the safety of everyone remains our top priority.
EASTSIDE
KING COUNTY
SEATTLE
SNOHOMISH COUNTY
VIEW FULL SNOHOMISH COUNTY REPORT
This post originally appeared on GetTheWReport.com
Local Market Update – April 2020


Windermere is focused on keeping our clients and our community safe and connected. We’re all in this together. Since the early days of COVID-19, our philosophy has been “Go slow and do no harm.” While real estate has been deemed an “essential” business, we have adopted guidelines that prioritize everyone’s safety and wellness.
Like everything else in our world, real estate is not business as usual. While market statistics certainly aren’t our focus at this time, we’ve opted to include our usual monthly report for those who may be interested. A few key points:
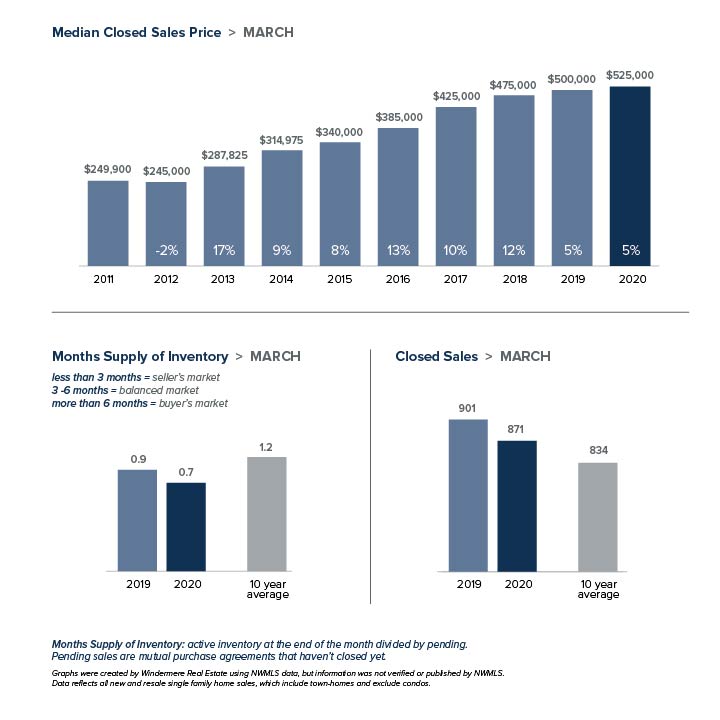
- The monthly statistics are based on closed sales. Since closing generally takes 30 days, the statistics for March are mostly reflective of contracts signed in February, a time period largely untouched by COVID-19. The market is different today.
- We expect that inventory and sales will decline in April and May as a result of the governor’s Stay Home order.
- Despite the effects of COVID-19, the market in March was hot through mid-month. It remains to be seen if that indicates the strong market will return once the Stay Home order is lifted, or if economic changes will soften demand.
Every Monday Windermere Chief Economist Matthew Gardner provides an update regarding the impact of COVID-19 on the US economy and housing market. You can get Matthew’s latest update here.
Stay healthy and be safe. We’ll get through this together.
EASTSIDE
KING COUNTY
SEATTLE
SNOHOMISH COUNTY
VIEW FULL SNOHOMISH COUNTY REPORT
This post originally appeared on GetTheWReport.com
Local Market Update – February 2020

New jobs and low interest rates continue to fuel the housing market boom. While January is traditionally a slower month for activity, the new year saw steady buyer demand. With the number of sales exceeding new listings, all indicators point to a strong spring market.
EASTSIDE
The tech industry on the Eastside continues to grow rapidly. Microsoft and Alibaba both have significant expansions underway. Amazon expects to increase its workforce in Bellevue to 15,000 in the next few years, a sevenfold increase from today. As the economy continues to grow, inventory keeps being squeezed. There were 47% fewer single-family homes on the market in January than the year prior. Home prices have been stabilizing for some time, fluctuating slightly from month to month. In January the median home price slipped 2% over a year ago to $892,000.

KING COUNTY
The number of single-family homes on the market in King County was down nearly 44% from a year ago. That lack of inventory has resulted in more multiple offers and the return of review dates, where sellers identify a date to review all offers. Strong competition for a small supply of homes boosted the median home price 3% over the prior year to $630,525.

SEATTLE
The jobs outlook in Seattle for 2020 remains robust, and demand for homes continues to outstrip supply. Traffic at open houses in January reflected that demand, with one central Seattle homes priced in the $1.2 million range drawing more than 300 visitors. Home prices in the city have been relatively stable for the past 12 months. That remained the case in January where the median price for a single-family home inched up 1% over last year to $719,950.

SNOHOMISH COUNTY
With 35% less inventory than last January, competition among buyers in Snohomish County is fierce and multiple offers have become the norm. The median price of a single-family home soared 12% over a year ago to $509,950. Home prices have been playing catch up, increasing at a much faster pace over the past year than King County. While the prices gap has closed, the median price here is still nearly 20% less than King County.

VIEW FULL SNOHOMISH COUNTY REPORT
This post originally appeared on GetTheWReport.com
The Gardner Report – Q4 2019 Western Washington

The following analysis of the Western Washington real estate market is provided by Windermere Real Estate Chief Economist, Matthew Gardner. We hope that this information may assist you with making better-informed real estate decisions. For further information about the housing market in your area, please don’t hesitate to contact us!
ECONOMIC OVERVIEW
Employment in Washington State continues to soften; it is currently at an annual growth rate of 1.7%. I believe that is a temporary slowdown and we will see the pace of employment growth improve as we move further into the new year. It’s clear that businesses are continuing to feel the effects of the trade war with China and this is impacting hiring practices. This is, of course, in addition to the issues that Boeing currently faces regarding the 737 MAX.
In the fourth quarter of 2019 the state unemployment rate was 4.4%, marginally lower than the 4.5% level of a year ago. My most recent economic forecast suggests that statewide job growth in 2020 will rise 2.2%, with a total of 76,300 new jobs created.
HOME SALES
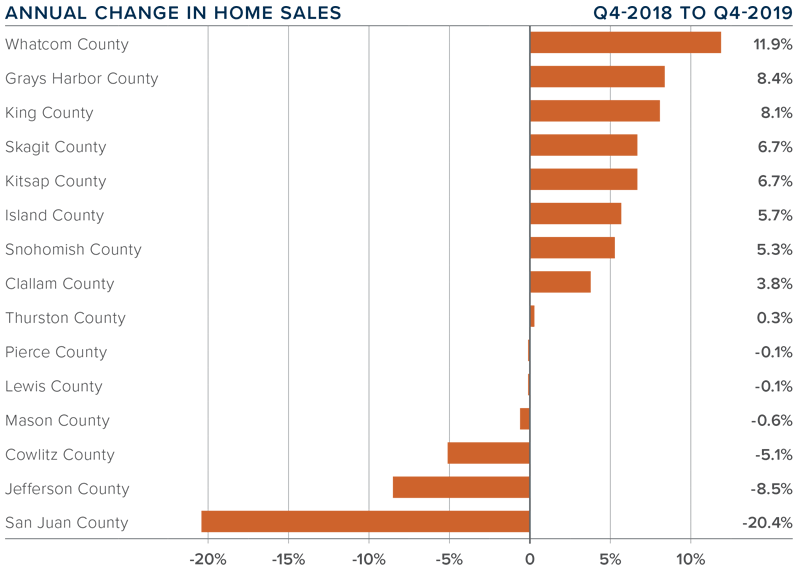
- There were 18,322 home sales registered during the final quarter of 2019, representing an impressive increase of 4.7% from the same period in 2018.
- Readers may remember that listing activity spiked in the summer of 2018 but could not be sustained, with the average number of listings continuing to fall. Year-over-year, the number of homes for sale in Western Washington dropped 31.7%.
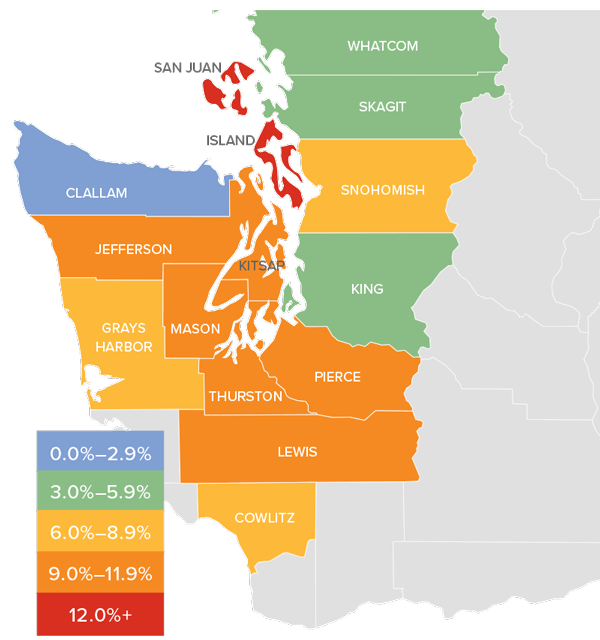
- Compared to the fourth quarter of 2018, sales rose in nine counties and dropped in six. The greatest growth was in Whatcom County. San Juan County had significant declines, but this is a very small market which makes it prone to extreme swings.
- Pending home sales — a barometer for future closings — dropped 31% between the third and fourth quarters of 2019, suggesting that we may well see a dip in the number of closed sales in the first quarter of 2020.
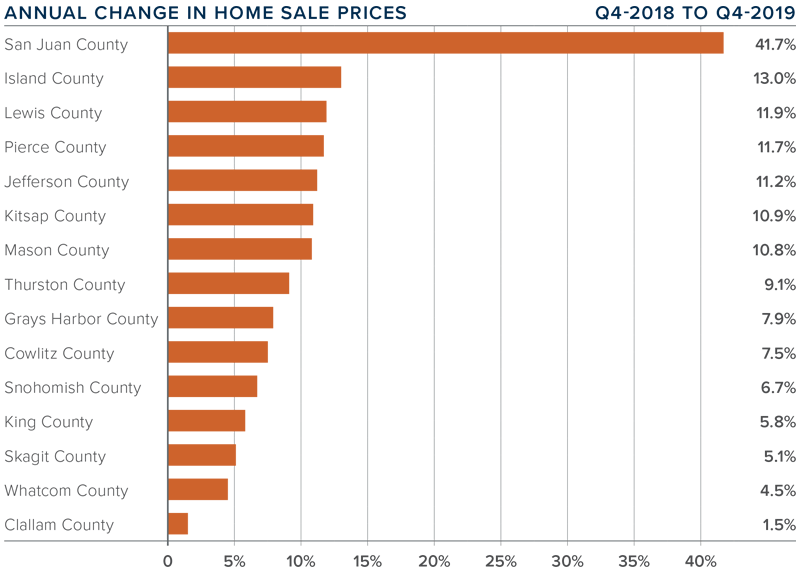
HOME PRICES
- Home price growth in Western Washington spiked during fourth quarter, with average prices 8.3% higher than a year ago. The average sale price in Western Washington was $526,564, 0.7% higher than in the third quarter of 2019.
- It’s worth noting that above-average price growth is happening in markets some distance from the primary job centers. I strongly feel this is due to affordability issues, which are forcing buyers farther out.
- Compared to the same period a year ago, price growth was strongest in San Juan County, where home prices were up 41.7%. Six additional counties also saw double-digit price increases.
- Home prices were higher in every county contained in this report. I expect this trend to continue in 2020, but we may see a softening in the pace of growth in some of the more expensive urban areas.
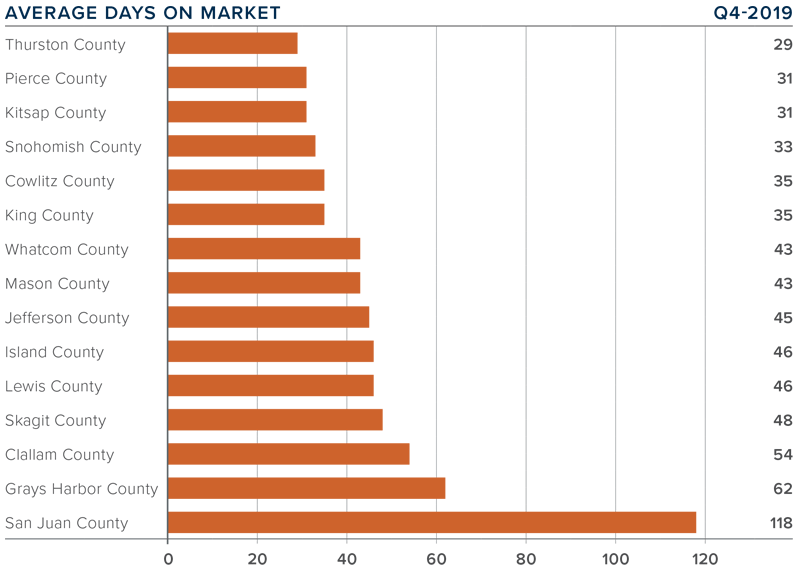
DAYS ON MARKET
- The average number of days it took to sell a home dropped four days compared to the third quarter of 2019.
- For the second quarter in a row, Thurston County was the tightest market in Western Washington, with homes taking an average of 29 days to sell. In nine counties, the length of time it took to sell a home dropped compared to the same period a year ago. Market time rose in four counties and two were unchanged.
- Across the entire region, it took an average of 47 days to sell a home in the fourth quarter. This was up nine days over the third quarter of this year.
- Market time remains below the long-term average across the region, a trend that will likely continue until we see more inventory come to market — possibly as we move through the spring.
CONCLUSIONS

This speedometer reflects the state of the region’s real estate market using housing inventory, price gains, home sales, interest rates, and larger economic factors.
The housing market ended the year on a high note, with transactions and prices picking up steam. I believe the uncertainty of 2018 (when we saw significant inventory enter the market) has passed and home buyers are back in the market. Unfortunately, buyers’ desire for more inventory is not being met and I do not see any significant increase in listing activity on the horizon. As such, I have moved the needle more in favor of home sellers.

As Chief Economist for Windermere Real Estate, Matthew Gardner is responsible for analyzing and interpreting economic data and its impact on the real estate market on both a local and national level. Matthew has over 30 years of professional experience both in the U.S. and U.K.
In addition to his day-to-day responsibilities, Matthew sits on the Washington State Governors Council of Economic Advisors; chairs the Board of Trustees at the Washington Center for Real Estate Research at the University of Washington; and is an Advisory Board Member at the Runstad Center for Real Estate Studies at the University of Washington where he also lectures in real estate economics.
This post originally appeared on the Windermere.com Blog.
Local Market Update – January 2020

2019 ended with too many buyers chasing too few homes. December marked the sixth straight month of declining supply. The severe shortage of homes, historically low interest rates, and strong job growth are predicted to keep the local housing market strong in 2020. In a region starved for inventory, sellers can expect significant interest in new listings.
EASTSIDE
Homes sold briskly on the Eastside in December in all categories, including the luxury market. The number of listings were down nearly 50% from a year ago and the area had under a month of available inventory. That lack of inventory helped bump the median price of a single-family home up 4% from a year ago to $949,000, which is a $49,000 increase from November. New large scale developments and a strong economic forecast indicate that the housing market will remain healthy.

KING COUNTY
King County continues to be a seller’s market. Inventory in December was down nearly 40% compared to a year ago and ended the month with below one month supply. The median price of a single-family home rose 6% over the prior year to $675,000, up slightly from November. More affordable areas saw much higher increases. Southeast King County – which includes Auburn, Kent and Renton – saw home prices jump 16% over the previous year.

SEATTLE
Numbers tell the story in Seattle. Inventory was down 25%, while the number of closed sales increased 19%. Strong demand here has kept the housing market solid, with prices fluctuating slightly month-to-month for much of 2019. The median price of a single-family home sold in December increased 2% from a year ago to $727,000. That was slightly down from $735,000 in November.

SNOHOMISH COUNTY
While the median home price in Snohomish County is less than that in King County, the gap continues to close. Buyers willing to trade a longer commute for a lower mortgage have kept demand and prices strong. Inventory here was off 36% in December as compared to a year ago. The median price of a single-family home rose 9% over a year ago to $510,000, an increase of $15,000 from November.

VIEW FULL SNOHOMISH COUNTY REPORT
This post originally appeared on GetTheWReport.com
So You Bought an Investment Property – Now What?

Image Source: Christopher Harris on Unspash
Investing in a home is a great way to build passive income but earning from your investment will take a little groundwork to become a well-oiled machine. This is your beginner’s guide to owning an investment property so you can set up that foundation properly to avoid future headaches.
Make sure it’s livable
It’s important to start with your home inspection before you start making plans. Use the inspection report to prioritize the maintenance issues.
Before a tenant moves in, make sure the home is livable. Handle the important items that affect the livability of the property, either now or in the near future. If the inspector noticed a leak in the roof or holes that could lead to infestation, take care of those first. Other maintenance issues to prioritize are the fuel and the hot water source.
If your city has inspection and registration requirements, be sure to cross check those inspection checklists with your current property. If the property wouldn’t pass now, make sure it will pass by the time the city sees it.
Upgrade the space
Once your property is in livable condition, it’s time to upgrade. If you have any left-over budget after the necessities are handled, consider adding a bedroom or a bathroom where you can find the space. These rooms heavily impact the rental price, and the more you have the higher the price. If there’s no space for another bed or bath, think about finishing the basement or upgrading some of the appliances to make the property more attractive to potential tenants.
Use similar properties in your neighborhood as your inspiration. These units are your competition, think about what you can add, or even take away, that would help you compete. Ask yourself what about your home is unique and in what ways does that affect your rentability? If every unit in your area has hardwoods, how can you make your carpeted home appealing? Maybe new carpet? Or is switching to hardwoods, or vinyl laminate that looks like wood, worth it?
Market it to future tenants
You need two things in your listing: 1) Great Photos 2) An Amazing Description
After you’ve perfected the property, it’s time to tell potential tenants that it’s available. Creating the listing is essential in drawing eyes on the unit so you can show it to as many people as possible.
Renters looking to move are quick to make their first impression of a property with thumbnail photos on a map. So, take lots of great, bright, photos of the entire place to showcase the amenities and show potential tenants what it looks like, then choose the best photo to be the first in the lineup. Remember to get the lighting is just right to show every corner of the listing. Dark photos scare tenants away, making them think the unit is dingy and dirty. Light and bright photos show a clean home that’s move-in ready. They can imagine themselves living there a lot easier than in dark and cramped looking units.
Next, they’ll read the description. This is again where other listings in your area can help you.
Read other listings to structure your description and to draw inspiration on what tenants might think is important. Find the selling points and emphasize those above the unique features, especially if those unique features are obvious in the photos.
This post originally appeared on the Windermere.com Blog
LOCAL MARKET UPDATE – NOVEMBER 2019

A steady influx of buyers continued to strain already tight inventory throughout the area in October. Home sales were up, as were prices in much of the region. With our thriving economy and highly desirable quality of life drawing ever more people here, the supply of homes isn’t close to meeting demand. Homeowners thinking about putting their property on the market can expect strong buyer interest.
EASTSIDE
As the Eastside continues to rack up “best places” awards, it’s no surprise that the area is booming. Development is on the rise, fueled primarily by the tech sector. The appeal of the Eastside has kept home prices here the highest of any segment of King County. The median single-family home price in October was stable as compared to the same time last year, rising 1% to $900,000.

KING COUNTY
King County’s 1.74 months of available inventory is far below the national average of four months. Despite the slim selection, demand in October was strong. The number of closed sales was up 5% and the number of pending sales (offers accepted but not yet closed) was up 11%. The median price of a single-family home was down 2% over a year ago to $660,000. However, some areas around the more reasonably-priced south end of the county saw double-digit price increases.

SEATTLE
Seattle home prices took their largest year-over-year jump in 12 months. The median price of a single-family home sold in October was up 3% from a year ago to $775,000, a $25,000 increase from September of this year. Seattle was recently named the third fastest-growing city in America. Real estate investment is surging. A growing population and booming economy continue to keep demand for housing –and home prices—strong.

SNOHOMISH COUNTY
Both the number of home sales and home prices were on the rise in Snohomish County in October. Overall homes sales increased 7%, and the median price of a single-family home rose 5% over a year ago to $495,000. Supply remains very low, with just six weeks of available inventory.

VIEW FULL SNOHOMISH COUNTY REPORT
This post originally appeared on GetTheWReport.com
Western Washington Real Estate Market Update – Q3 2019

The following analysis of the Western Washington real estate market is provided by Windermere Real Estate Chief Economist, Matthew Gardner. We hope that this information may assist you with making better-informed real estate decisions. For further information about the housing market in your area, please don’t hesitate to contact us!
ECONOMIC OVERVIEW
Washington State employment has softened slightly to an annual growth rate of 2%, which is still a respectable number compared to other West Coast states and the country as a whole. In all, I expect that Washington will continue to add jobs at a reasonable rate though it is clear that businesses are starting to feel the effects of the trade war with China and this is impacting hiring practices. The state unemployment rate was 4.6%, marginally higher than the 4.4% level of a year ago. My most recent economic forecast suggests that statewide job growth in 2019 will rise by 2.2%, with a total of 88,400 new jobs created.
HOME SALES
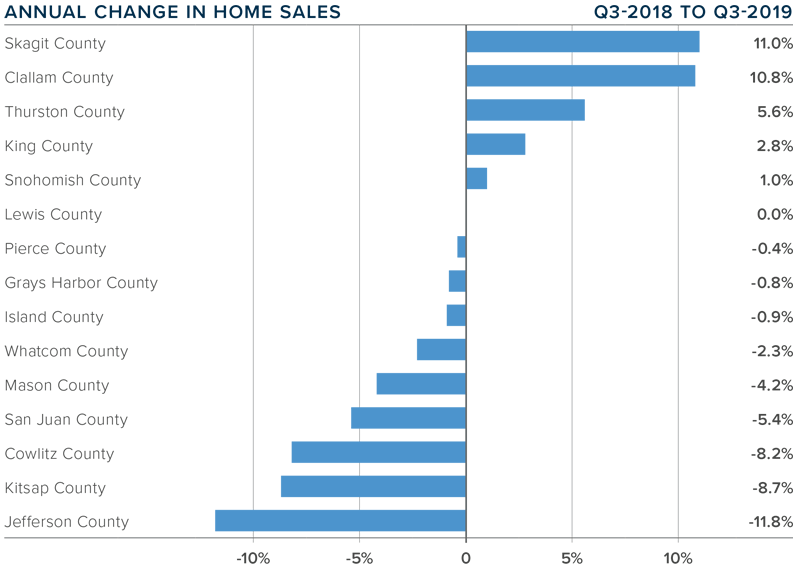
- There were 22,685 home sales during the third quarter of 2019, representing a slight increase of 0.8% from the same period in 2018 and essentially at the same level as in the second quarter.
- Listing activity — which rose substantially from the middle of last year — appears to have settled down. This is likely to slow sales as there is less choice in the market.
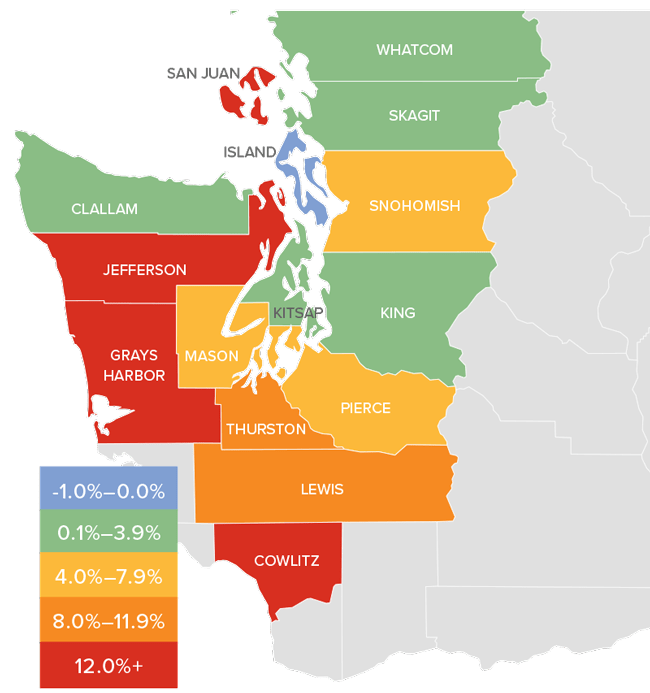
- Compared to the third quarter of 2018, sales rose in five counties, remained static in one, and dropped in nine. The greatest growth was in Skagit and Clallam counties. Jefferson, Kitsap, and Cowlitz counties experienced significant declines.
- The average number of homes for sale rose 11% between the second and third quarters. However, inventory is 14% lower than in the same quarter of 2018. In fact, no county contained in this report had more homes for sale in the third quarter than a year ago.
HOME PRICES
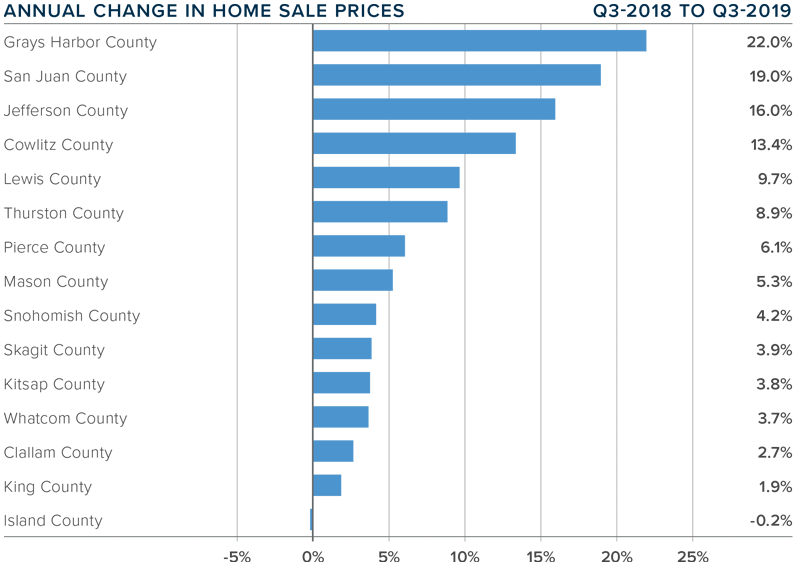
- Home price growth in Western Washington notched a little higher in the third quarter, with average prices 4.2% higher than a year ago. The average sales price in Western Washington was $523,016. It is worth noting, though, that prices were down 3.3% compared to the second quarter of this year.
- Home prices were higher in every county except Island, though the decline there was very small.
- When compared to the same period a year ago, price growth was strongest in Grays Harbor County, where home prices were up 22%. San Juan, Jefferson, and Cowlitz counties also saw double-digit price increases.
- Affordability issues are driving buyers further out which is resulting in above-average price growth in outlying markets. I expect home prices to continue appreciating as we move through 2020, but the pace of growth will continue to slow.
DAYS ON MARKET
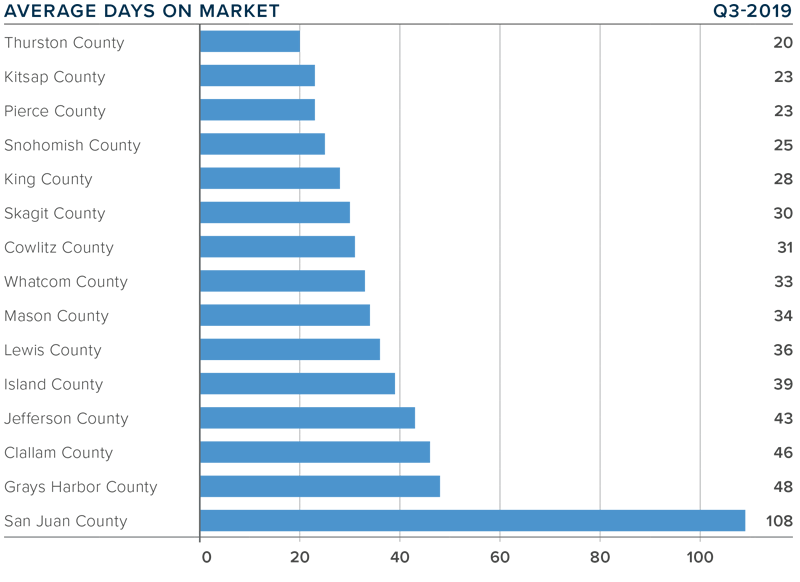
- The average number of days it took to sell a home dropped one day when compared to the third quarter of 2018.
- Thurston County was the tightest market in Western Washington, with homes taking an average of only 20 days to sell. There were six counties where the length of time it took to sell a home dropped compared to the same period a year ago. Market time rose in six counties, while two counties were unchanged.
- Across the entire region, it took an average of 38 days to sell a home in the third quarter. This was down 3 days compared to the second quarter of this year.
- Market time remains below the long-term average across the region and this trend is likely to continue until more inventory comes to market, which I do not expect will happen until next spring.
CONCLUSIONS

This speedometer reflects the state of the region’s real estate market using housing inventory, price gains, home sales, interest rates, and larger economic factors. I am leaving the needle in the same position as the first and second quarters, as demand appears to still be strong.
The market continues to benefit from low mortgage rates. The average 30-year fixed rates is currently around 3.6% and is unlikely to rise significantly anytime soon. Even as borrowing costs remain very competitive, it’s clear buyers are not necessarily jumping at any home that comes on the market. Although it’s still a sellers’ market, buyers have become increasingly price-conscious which is reflected in slowing home price growth.
As Chief Economist for Windermere Real Estate, Matthew Gardner is responsible for analyzing and interpreting economic data and its impact on the real estate market on both a local and national level. Matthew has over 30 years of professional experience both in the U.S. and U.K.
In addition to his day-to-day responsibilities, Matthew sits on the Washington State Governors Council of Economic Advisors; chairs the Board of Trustees at the Washington Center for Real Estate Research at the University of Washington; and is an Advisory Board Member at the Runstad Center for Real Estate Studies at the University of Washington where he also lectures in real estate economics.
This post originally appeared on the Windermere.com Blog.
Local Market Update – September 2019

A decrease in inventory coupled with an increase in sales activity led to fewer options for home shoppers in August. There is some good news for would-be buyers as mortgage rates have dropped to their lowest level in three years. Demand remains high but there simply aren’t enough homes on the market. Brokers are hoping to see the traditional seasonal influx of new inventory as we move forward.
EASTSIDE
The median price of a single-family home on the Eastside was $935,000 in August, unchanged from a year ago and up slightly from $925,000 in July. New commercial and residential construction projects are in the works. Strong demand for downtown condos has prompted plans for yet another high-rise tower to break ground next year.

KING COUNTY
Home prices in King County were flat in August. The median price of a single-family home was $670,000, virtually unchanged from a year ago, and down just one percent from July. Southeast King County, which has some of the most reasonable housing values in the area, saw prices increase 9% over last year. Inventory remains very low. Year-over-year statistics show the volume of new listings dropped 18.5% in King County.

SEATTLE
Homes sales were up 12% in Seattle for August, putting additional pressure on already slim inventory. There is just over six weeks of available supply. There are signs that prices here are stabilizing as the median home price of $760,000 was unchanged from a year ago and up less than one percent from July. With its booming economy, demand here is expected to stay strong.

SNOHOMISH COUNTY
Buyers looking for more affordable options outside of King County pushed pending sales, mutually accepted offers, up nearly 16% over a year ago. Home prices have softened slightly. The median price of a single-family home in August was $490,000, down slightly from the median of $492,225 the same time last year.

VIEW FULL SNOHOMISH COUNTY REPORT
This post originally appeared on GetTheWReport.com
