
 Facebook
 X
X
 Pinterest
 Copy Link
Local Market Update – May 2021
A sizeable increase in new listings in April offered some good news for buyers, but it was matched by an even greater increase in sales. With supplies depleted, and homes being snapped up within days, nearly every area saw double-digit price gains. The current forecast as we head towards summer: the market remains as hot as ever.
Despite the influx of new listings, inventory in the region remains one of the tightest in the country. At the end of the month there were 43% fewer homes on the market in King County than there were a year ago. Snohomish County had 49% less inventory, and has just 519 single-family homes for sale in the entire county. There were only 309 homes for sale on the Eastside, which stretches from Renton to Woodinville. Demand is so outstripping supply that 95% of the homes that sold last month on the Eastside sold within two weeks. In Seattle that number was 84%.
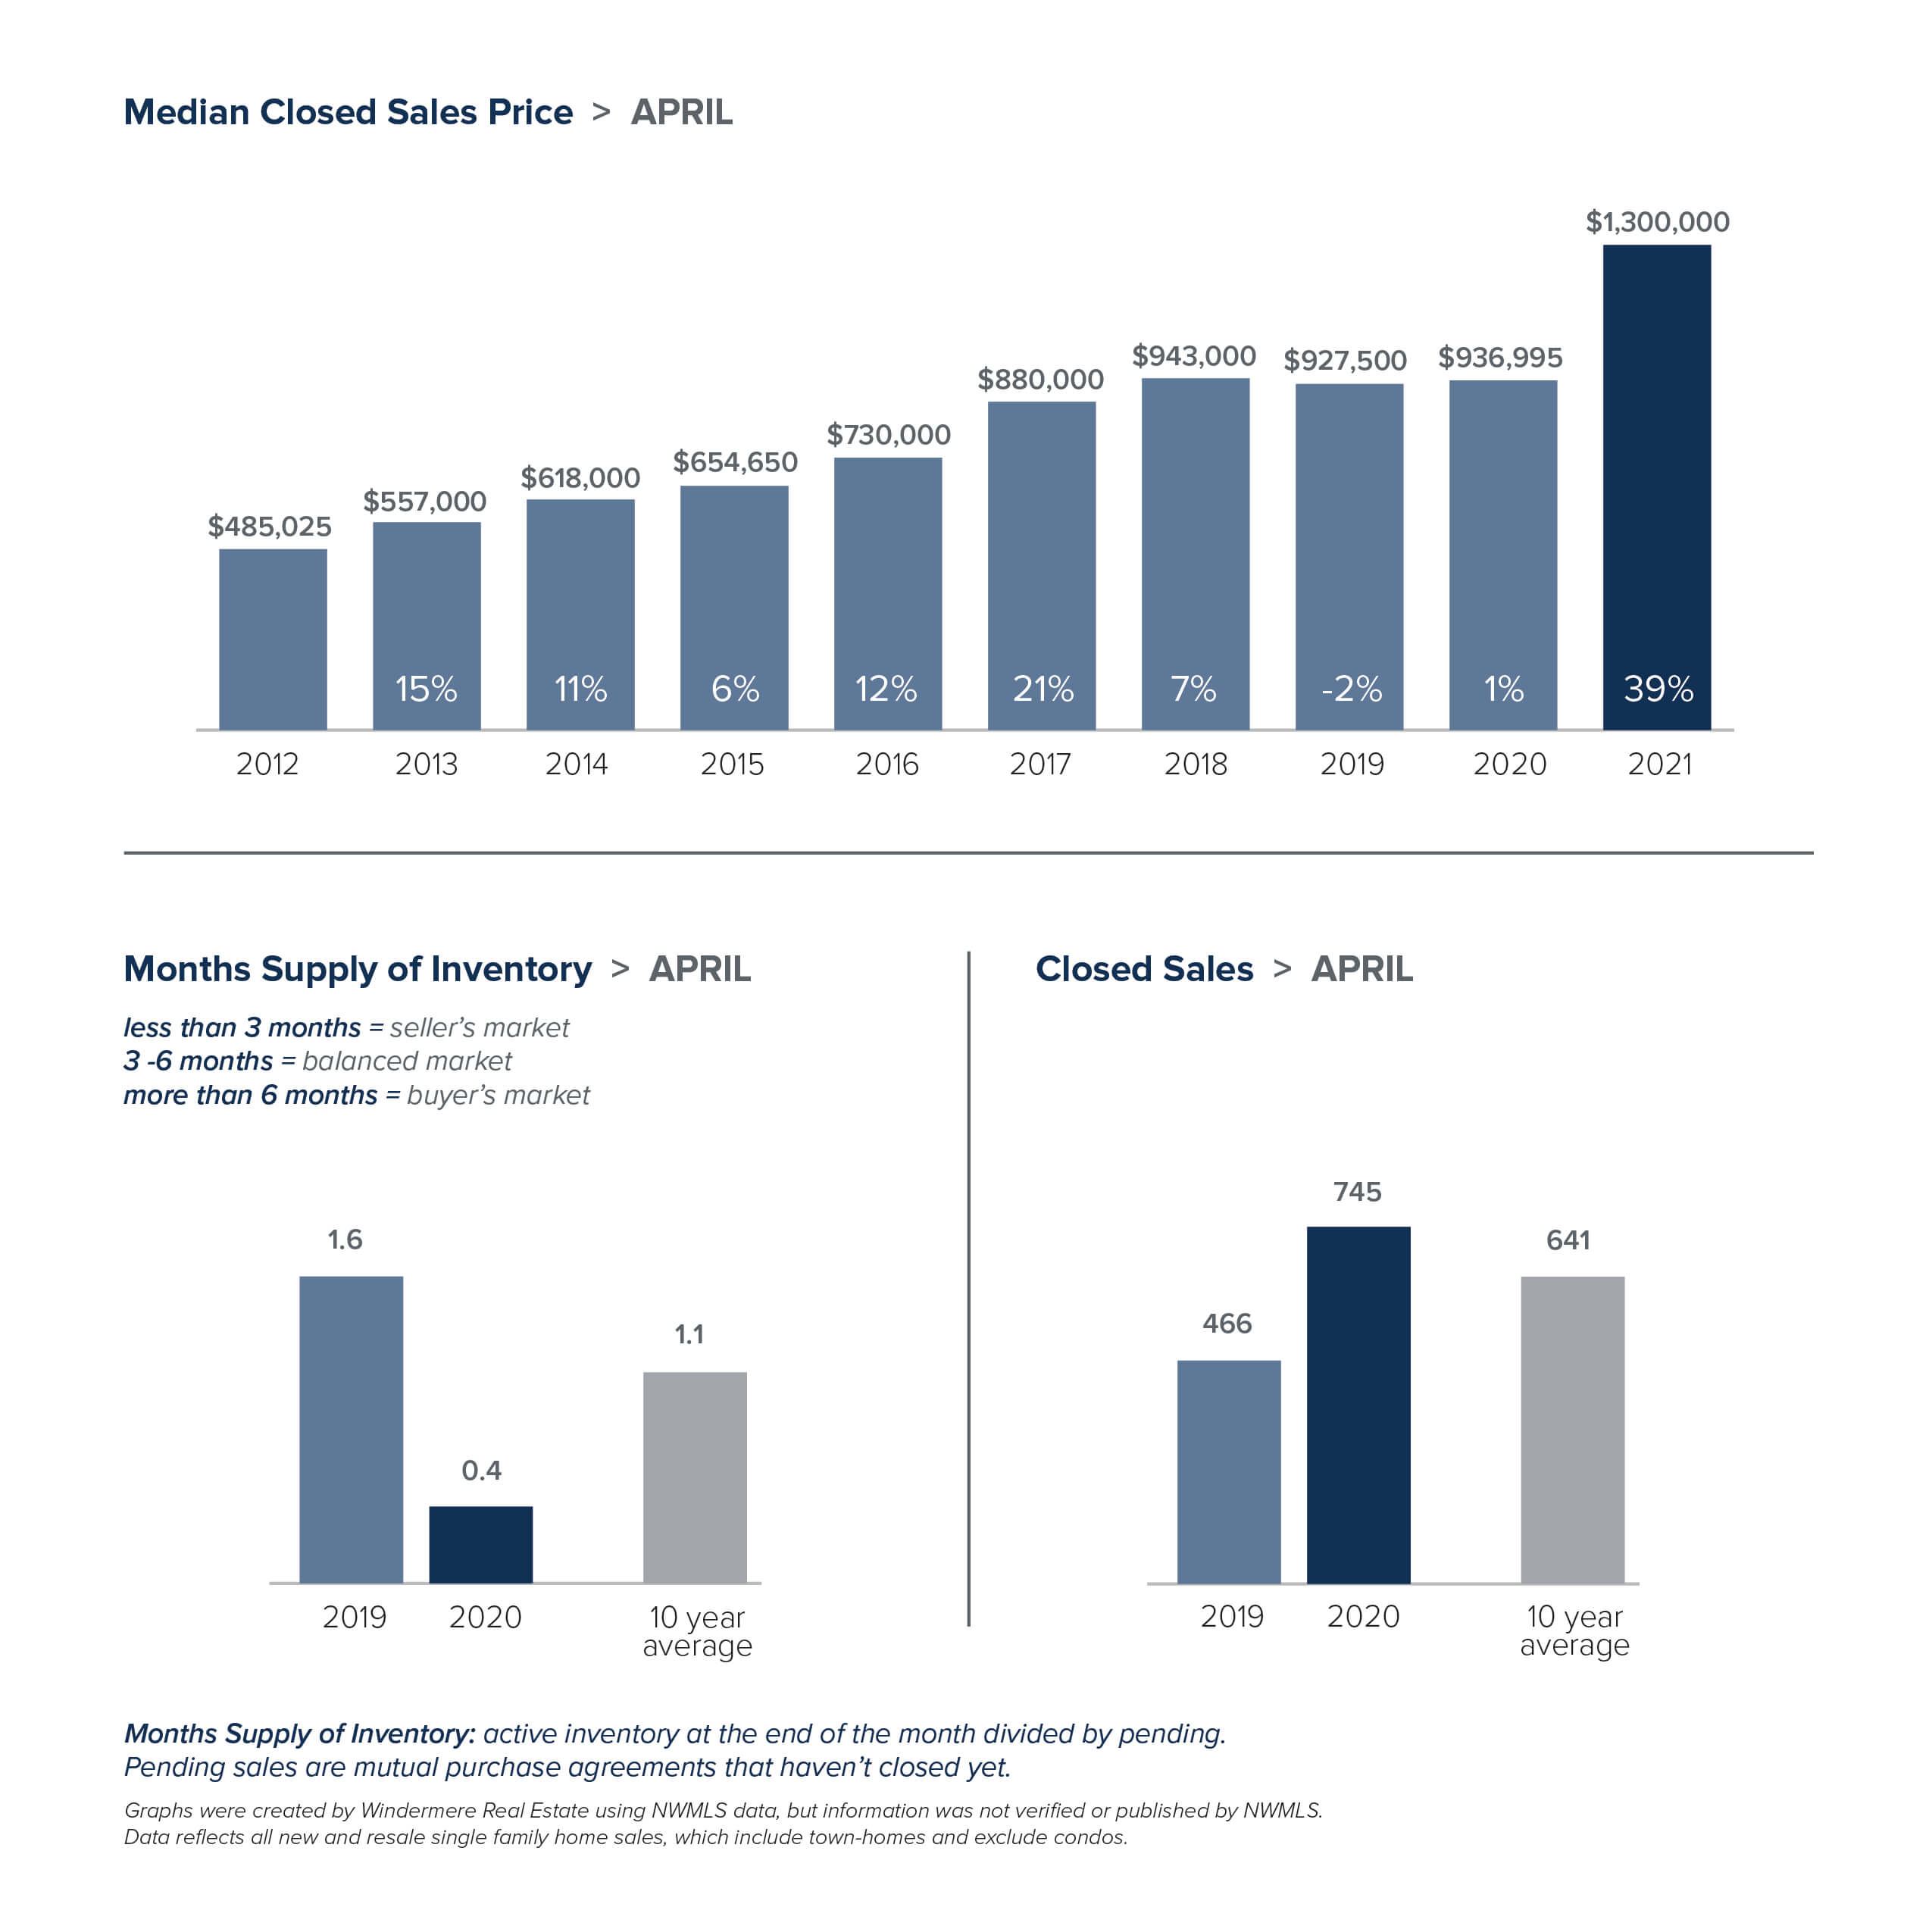
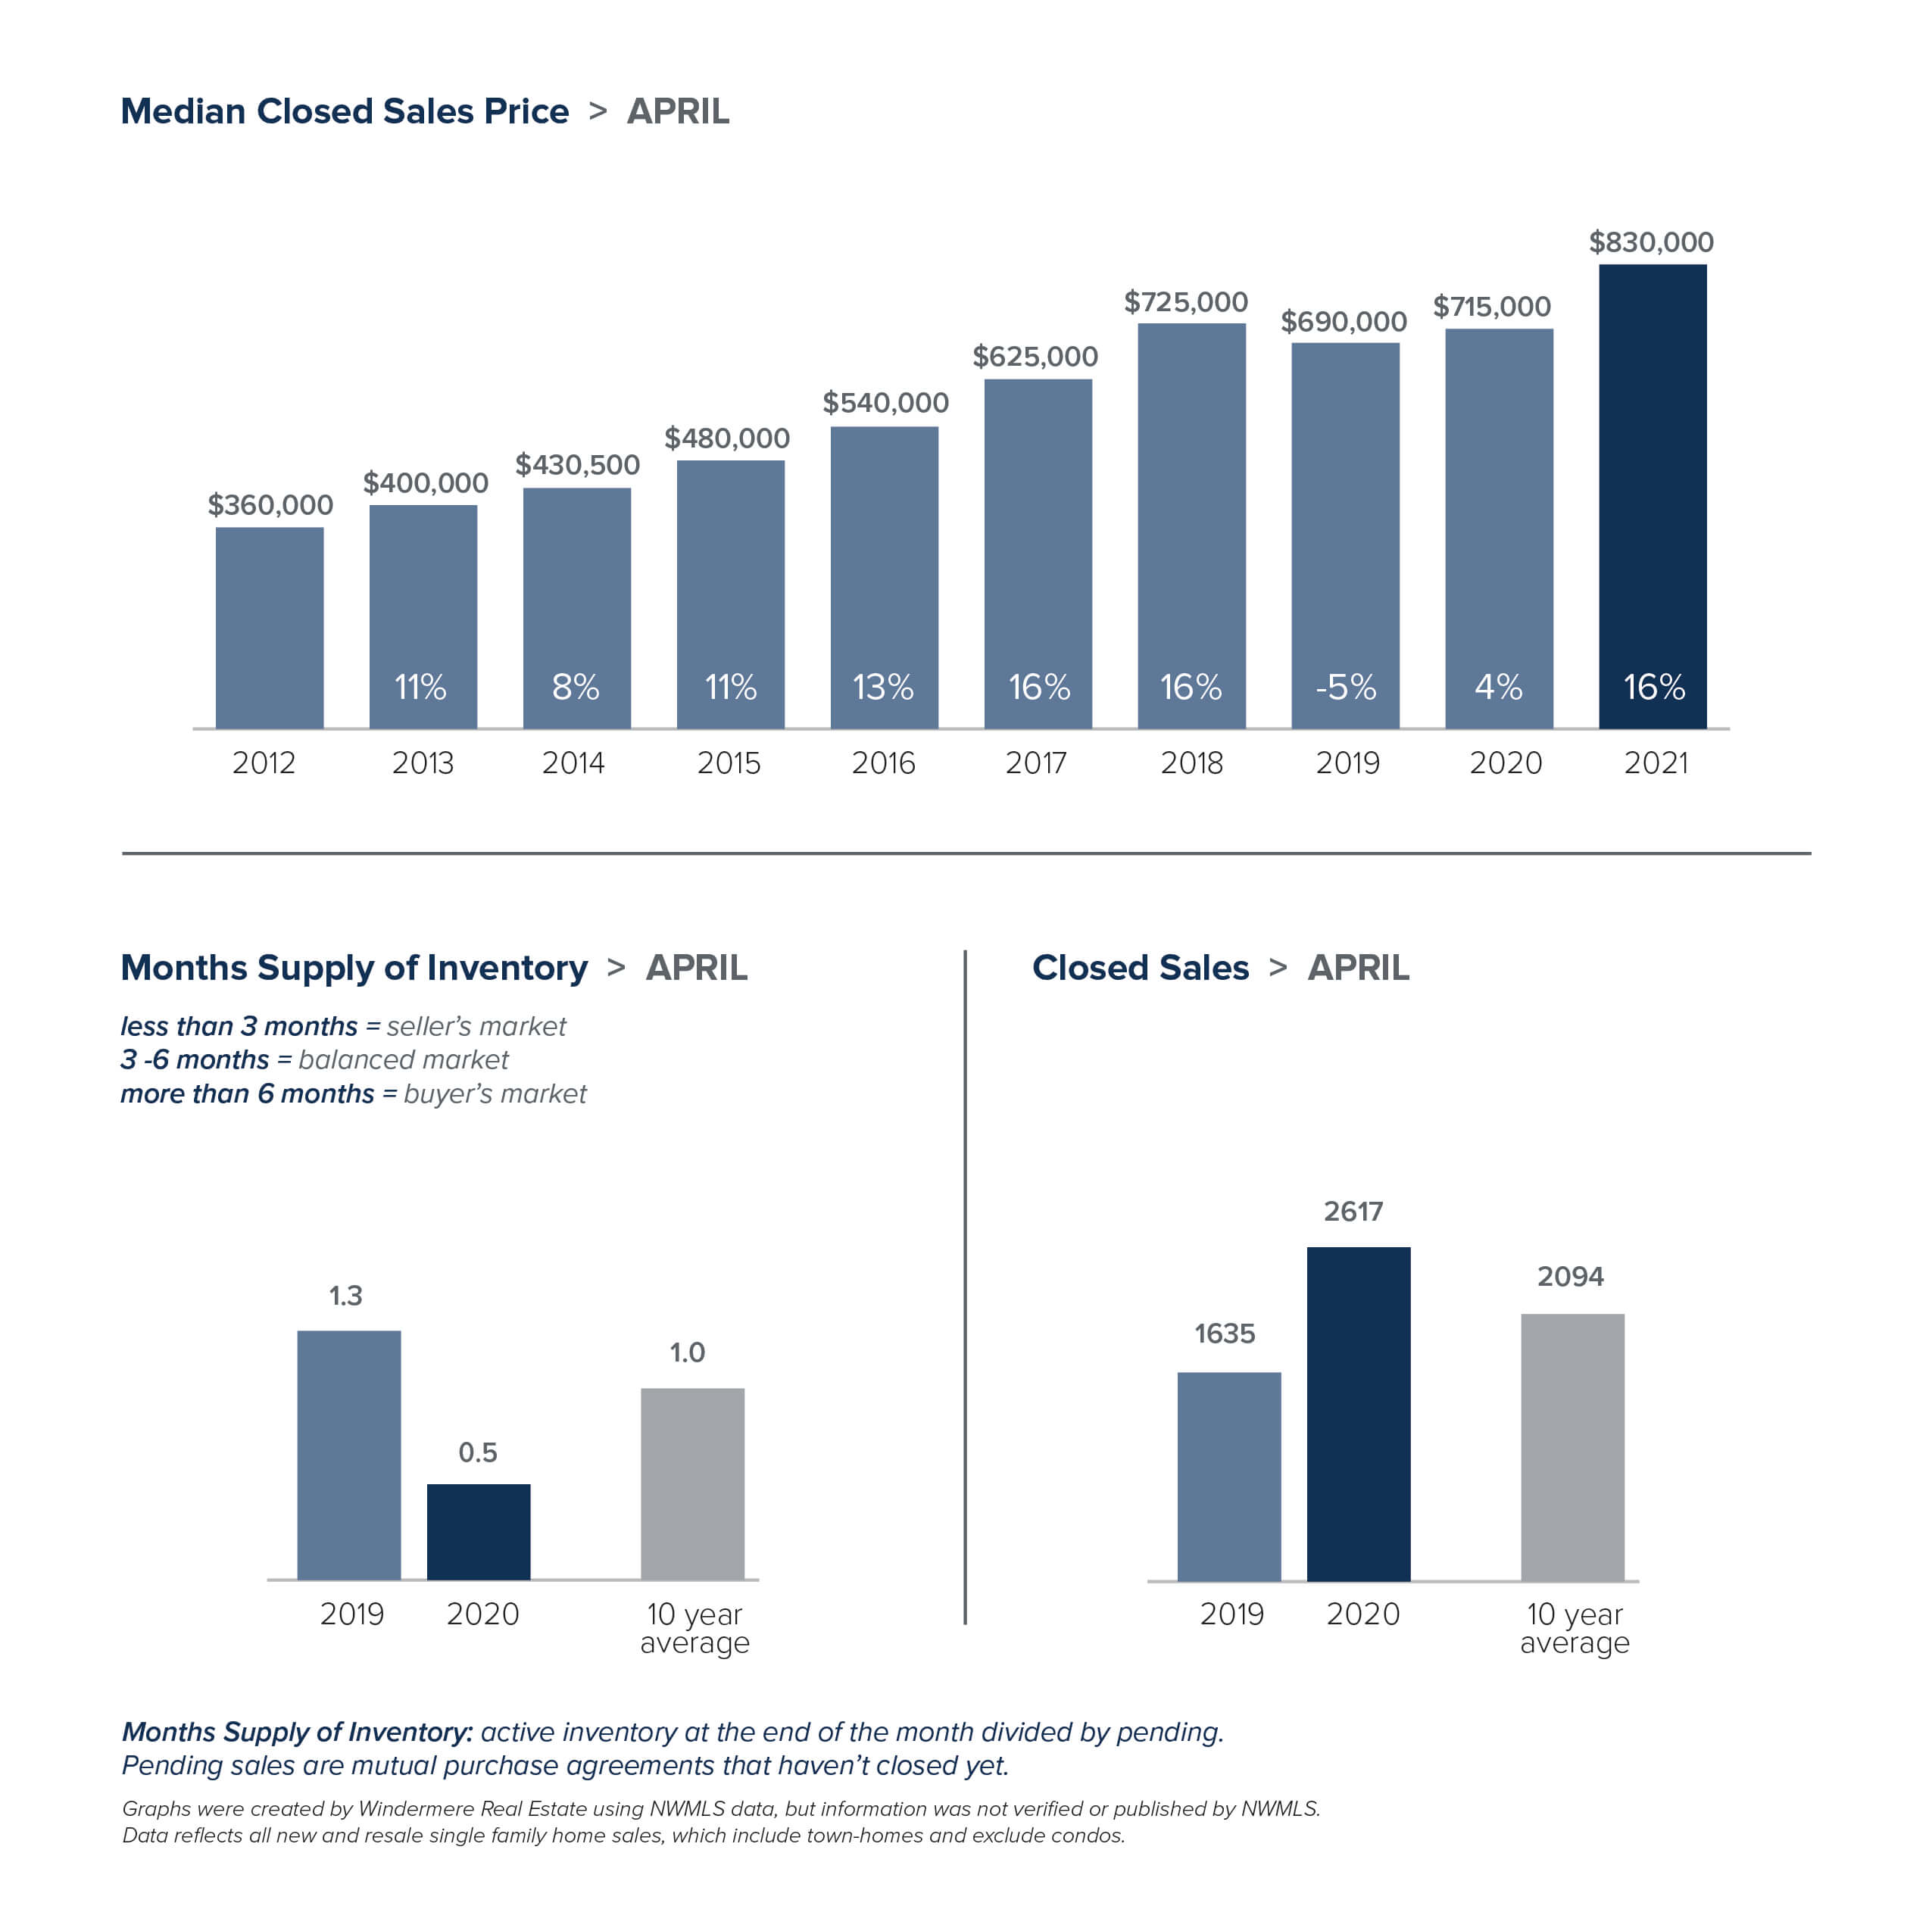
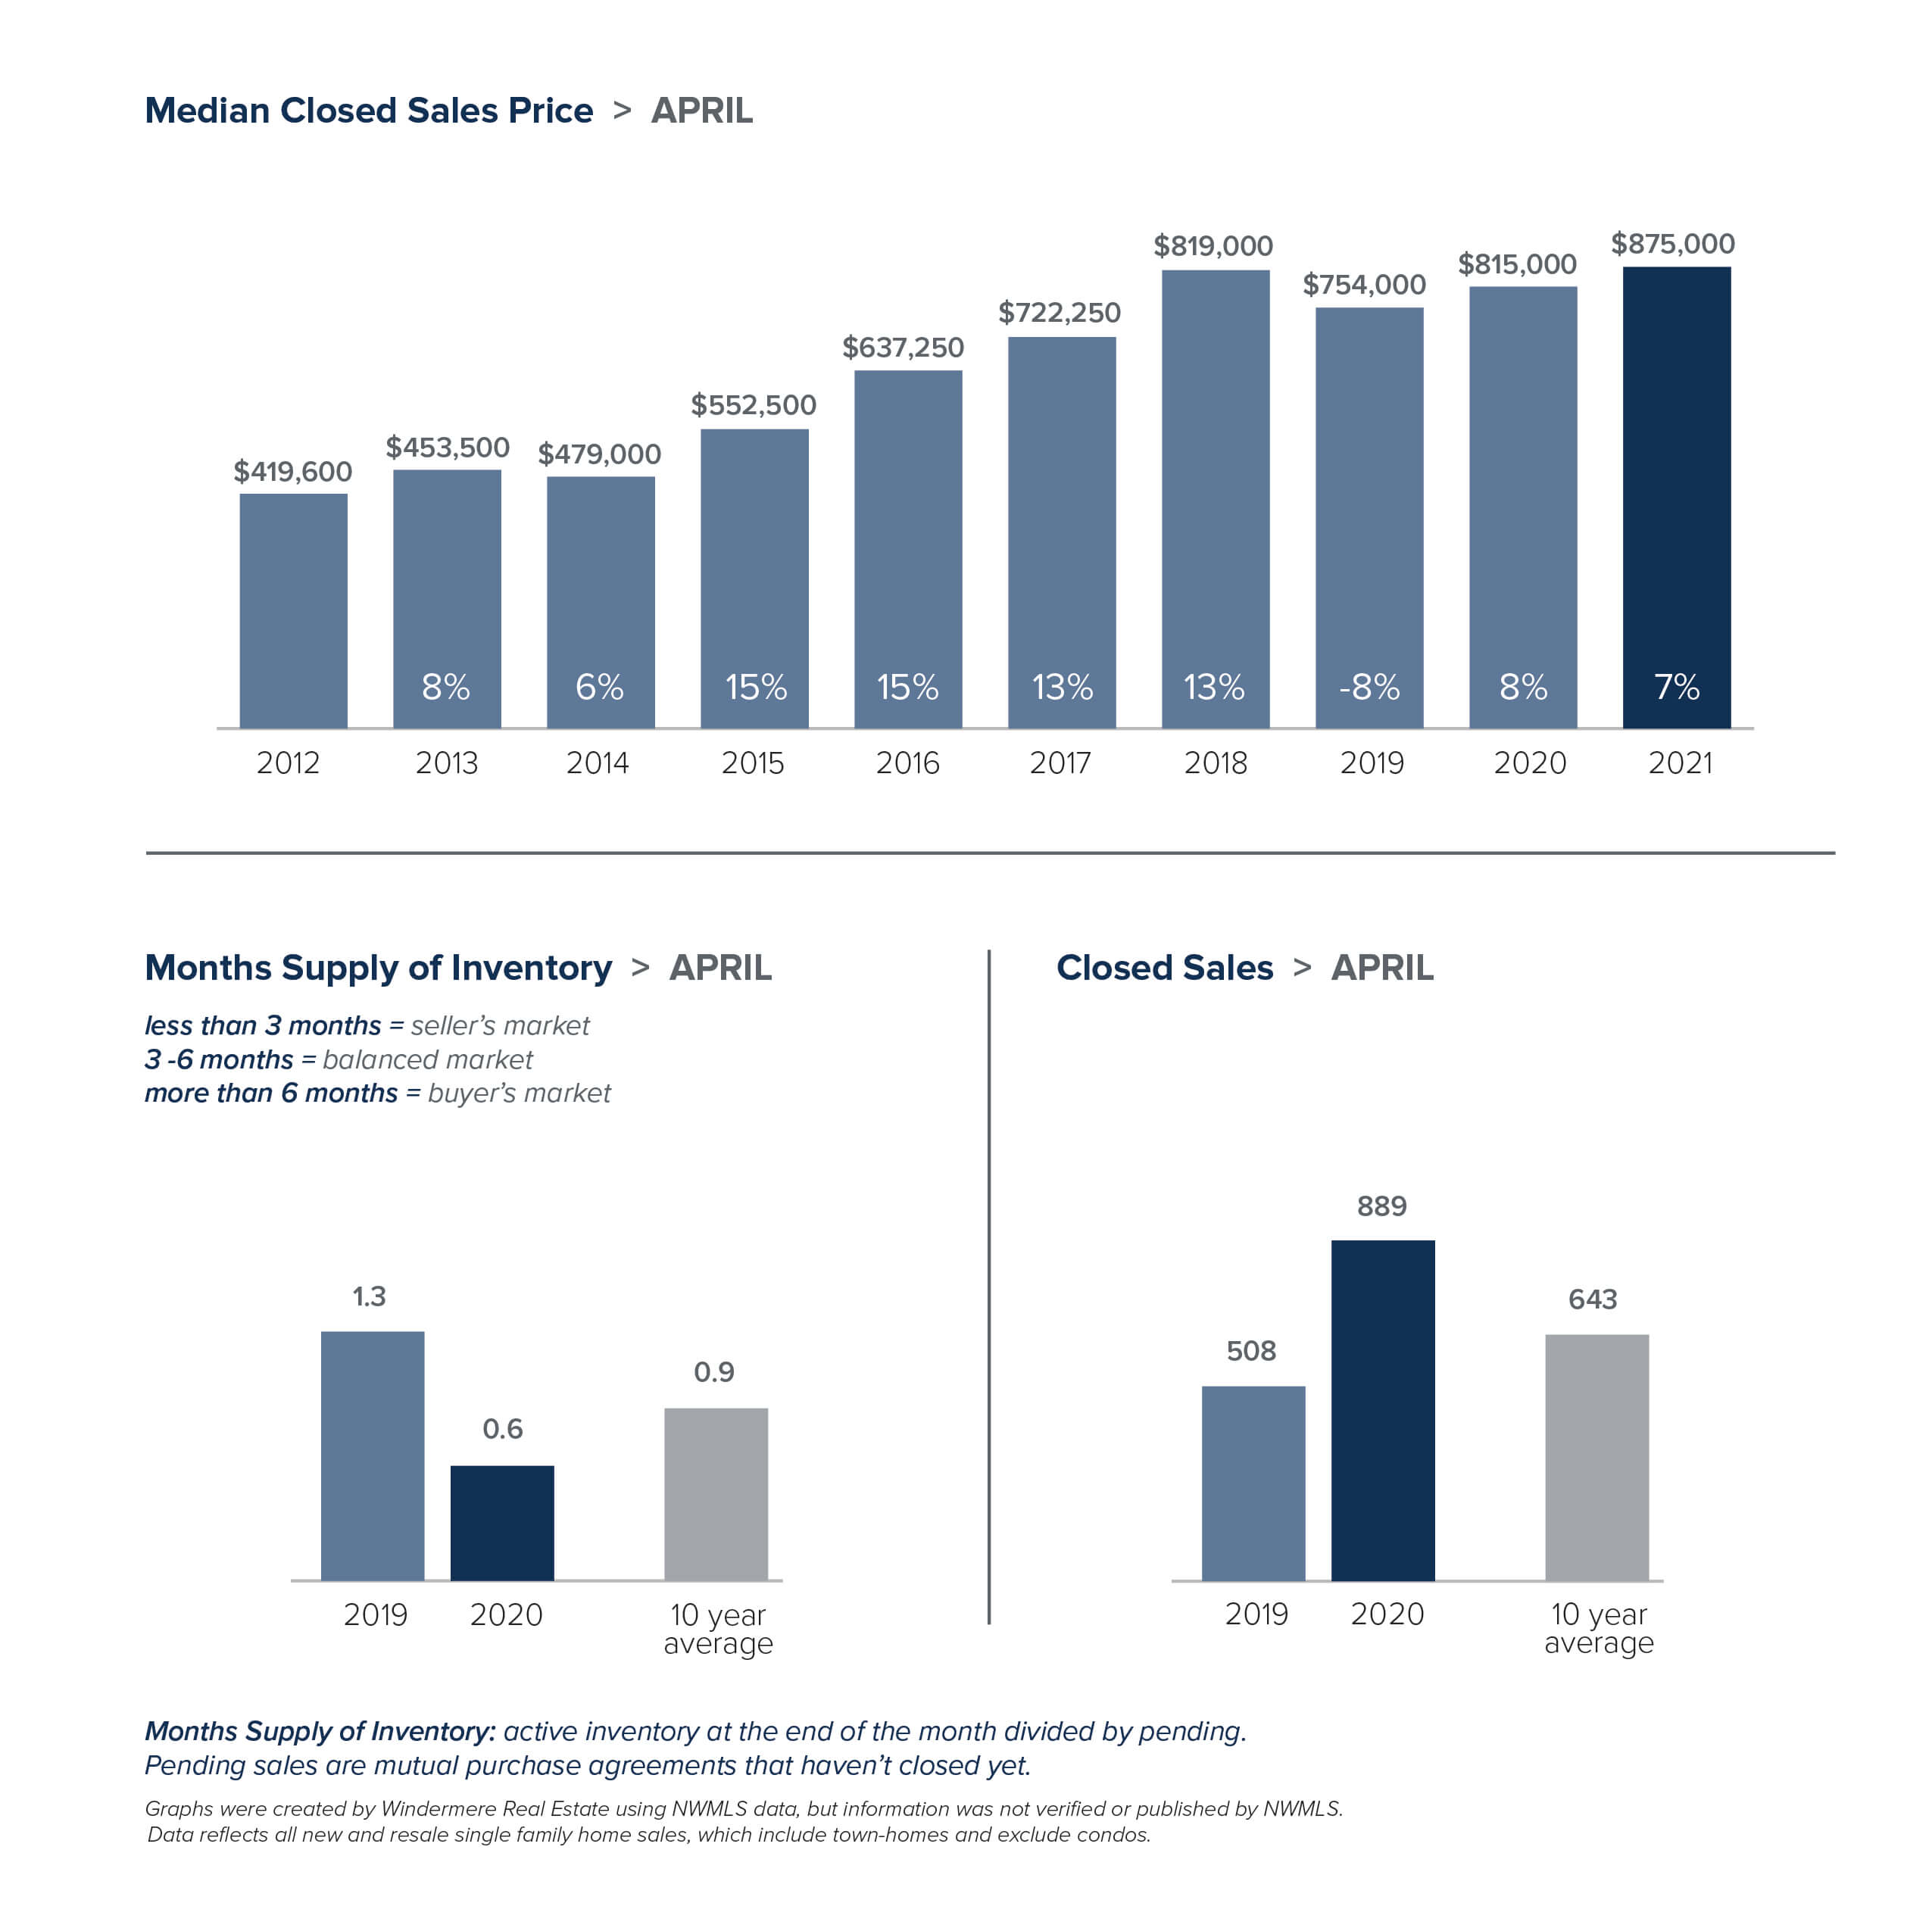
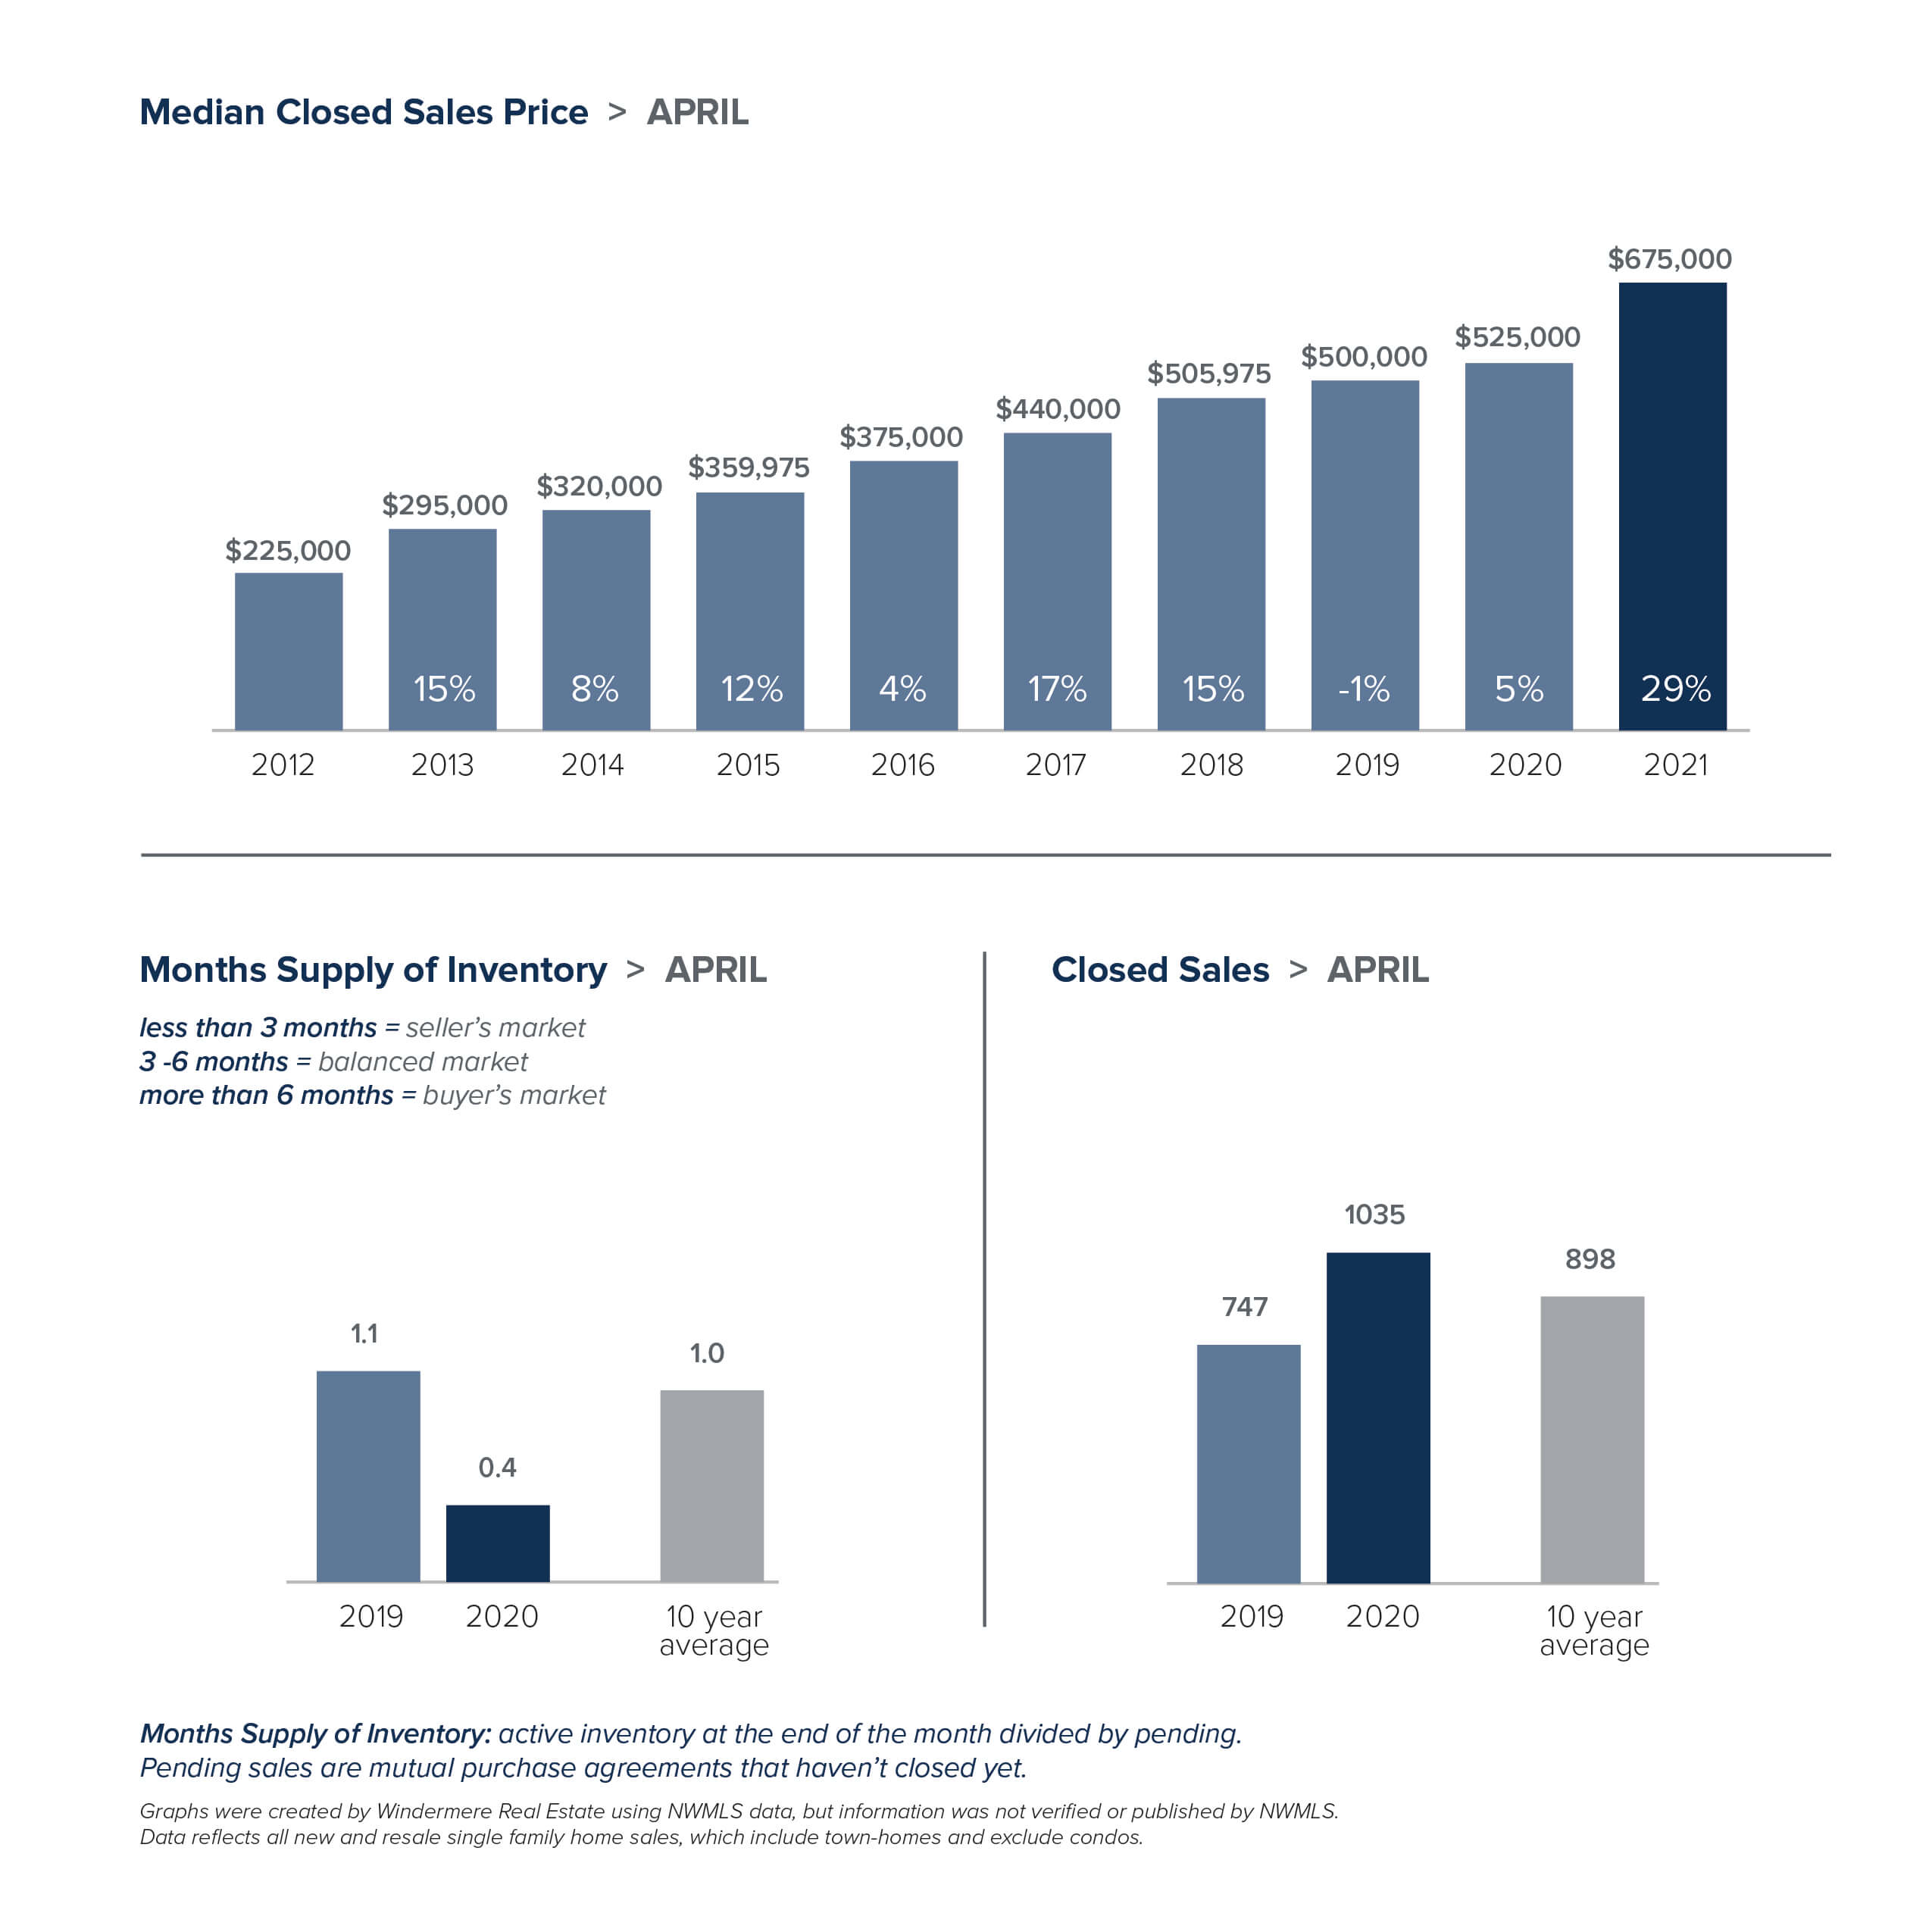
Home prices hit record highs in April, with nearly every area seeing double-digit price increases. The median price of a single-family home in King County last month was $830,000. Snohomish County’s median price soared to $675,000. Seattle’s median home price hit $875,000. All were new records. At $1.3 million, the median price on the Eastside was down slightly from its all-time high in March, but up a whopping 39% from the same time last year. In another show of the strength of the market, 82% of homes on the Eastside sold for over the list price. That compares with 60% of homes in Seattle. The Seattle market remains strong, however price appreciation there has slowed relative to other areas of King County and inventory has crept up. Condos present one bright spot for buyers. Price growth has been slower and inventory has been higher than for single-family homes. The $460,000 median price for a condo in King County is 45% less than the median price of a single-family home there.
Needless to say, this is a challenging market for buyers. With multiple offers and escalation clauses the norm, it’s critical to work with your broker on a plan to consider all possible scenarios when looking to buy a home. If you’re thinking about selling, it’s an ideal time to get a maximum return on your property before the prospect of rising interest rates starts to moderate the market.
The charts below provide a brief overview of market activity. If you are interested in more information, every Monday Windermere Chief Economist Matthew Gardner provides an update on the US economy and housing market. You can get Matthew’s latest update here.
EASTSIDE
KING COUNTY
SEATTLE
SNOHOMISH COUNTY
VIEW FULL SNOHOMISH COUNTY REPORT
This post originally appeared on GettheWReport.com
The Gardner Report – Q1 2021

The following analysis of the Western Washington real estate market is provided by Windermere Real Estate Chief Economist Matthew Gardner. We hope that this information may assist you with making better-informed real estate decisions. For further information about the housing market in your area, please don’t hesitate to contact us!
REGIONAL ECONOMIC OVERVIEW
In the summer and fall of 2020, Western Washington regained some of the jobs lost due to COVID-19, but employment levels in the region have been in a holding pattern ever since. As of February, the region had recovered 132,000 of the 297,000 jobs that were lost, but that still leaves the area down by 165,000 positions. Given the announcement that several counties may have to roll back to phase 2 of reopening, I would not be surprised to see businesses hold off on plans to add to their payrolls until the picture becomes clearer. Even with this “pause” in the job recovery, the region’s unemployment rate ticked down to 6.1% from the December rate of 6.4% (re-benchmarking in 2020 showed the December rate was higher than the originally reported 5.5%). The lowest rate was in King County (5.3%) and the highest rate was in Grays Harbor County, which registered at 9.2%. Despite the adjustment to the 2020 numbers, my forecast still calls for employment levels to increase as we move through the year, though the recovery will be slower in areas where COVID-19 infection rates remain elevated.
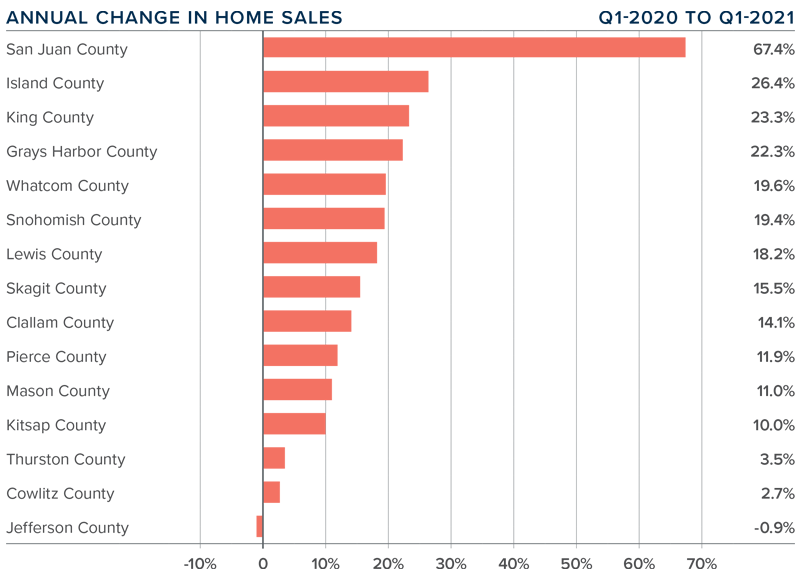
WESTERN WASHINGTON HOME SALES
❱ Sales in the first quarter were impressive, with 15,893 home sales. This is an increase of 17.5% from the same period in 2020, but 32% lower than in the final quarter of last year—a function of low levels of inventory.
❱ Listing activity continues to be well below normal levels, with total available inventory 40.7% lower than a year ago, and 35.5% lower than in the fourth quarter of 2020.
❱ Sales rose in all counties other than Jefferson, though the drop there was only one unit. There were significant increases in almost every other county, but sales growth was more muted in Cowlitz and Thurston counties. San Juan County again led the way, likely due to ongoing interest from second-home buyers.
❱ The ratio of pending sales (demand) to active listings (supply) shows how competitive the market is. Western Washington is showing pendings outpacing new listings by a factor of almost six to one. The housing market is as tight now as I have ever seen it.
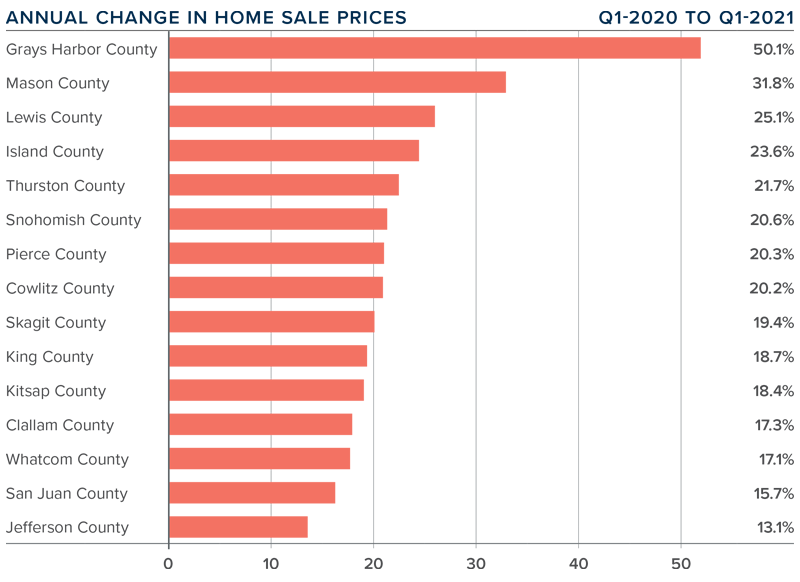
WESTERN WASHINGTON HOME PRICES
❱ Home price growth in Western Washington continues to trend well above the long-term average, with prices 21.3% higher than a year ago. The average home sale price was $635,079.
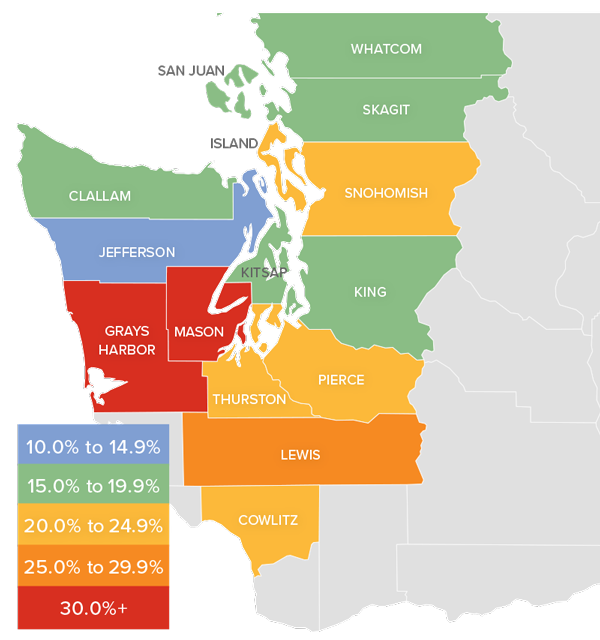
❱ Compared to the same period a year ago, price growth was strongest in Grays Harbor and Mason counties, but all markets saw double-digit price growth compared to a year ago.
❱ Home prices were also 2.9% higher than in the final quarter of 2020, which was good to see given that 30-year mortgage rates rose .4% in the quarter.
❱ I expect to see mortgage rates continue to trend higher as we move through the year, but they will remain significantly lower than the long-term average. Any increase in rates can act as a headwind to home-price growth, but excessive demand will likely cause prices to continue to rise.
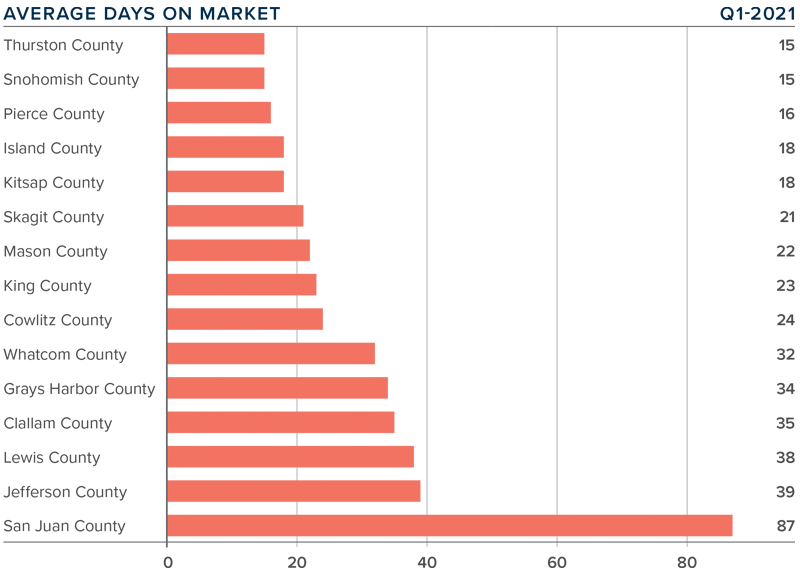
DAYS ON MARKET
❱ The market in early 2021 continued to show far more demand than supply, which pushed the average time it took to sell a home down 25 days compared to a year ago. It took 2 fewer days to sell a home than it did in the final quarter of 2020.
❱ Snohomish and Thurston counties were the tightest markets in Western Washington, with homes taking an average of only 15 days to sell. The greatest drop in market time was in San Juan County, where it took 52 fewer days to sell a home than it did a year ago.
❱ Across the region, it took an average of only 29 days to sell a home in the quarter. All counties saw market time decrease from the first quarter of 2020.
❱ Very significant demand, in concert with woefully low levels of supply, continues to make the region’s housing market very competitive. This will continue to be a frustration for buyers.
CONCLUSIONS

This speedometer reflects the state of the region’s real estate market using housing inventory, price gains, home sales, interest rates, and larger economic factors.
Demand is very strong and, even in the face of rising mortgage rates, buyers are still out in force. With supply still lagging significantly, it staunchly remains a seller’s market. As such, I am moving the needle even further in their favor.
As I mentioned in last quarter’s Gardner Report, 2021 will likely see more homeowners make the choice to sell and move if they’re allowed to continue working remotely. On the one hand, this is good for buyers because it means more listings to choose from. However, if those sellers move away from the more expensive core markets into areas where housing is cheaper, it could lead to increased competition and affordability issues for the local buyers in those markets.
ABOUT MATTHEW GARDNER

As Chief Economist for Windermere Real Estate, Matthew Gardner is responsible for analyzing and interpreting economic data and its impact on the real estate market on both a local and national level. Matthew has over 30 years of professional experience both in the U.S. and U.K.
In addition to his day-to-day responsibilities, Matthew sits on the Washington State Governors Council of Economic Advisors; chairs the Board of Trustees at the Washington Center for Real Estate Research at the University of Washington; and is an Advisory Board Member at the Runstad Center for Real Estate Studies at the University of Washington where he also lectures in real estate economics.
This post originally appeared on the Windermere.com blog
Local Market Update – April 2021
Despite a bump in new listings the supply of homes still can’t keep up with the demand. The result? Multiple offers, escalation clauses, and record-breaking prices. If you’re considering selling your home, you’d be hard pressed to find a more lucrative market than what we have today.
March marked the first post-COVID/pre-COVID comparison, and the results were dramatic.
The drop in the number of listings was profound. In King County there were 54% fewer single-family homes on the market at the end of March than the same time a year ago. The Eastside had 68% fewer listings. There were just 216 homes for sale on the Eastside, which stretches from Issaquah to Woodinville. Extensive new investments there, including Amazon’s plan to add 25,000 jobs in Bellevue, will only increase demand for housing. North King County, which includes Richmond Beach and Lake Forest Park had just 26 homes for sale. In Seattle, the 498 listings there represents a drop of 18% from a year ago. Despite the comparatively greater number of listings, Seattle still has only two weeks of available inventory. The situation was even more dire in Snohomish County. With the number of homes for sale down 68%, the county has just one week of inventory.
So why is inventory so low? The pandemic certainly has played a part. People now working from home have bought up properties with more space in more desirable locations. Nervousness and uncertainty about COVID compelled many would-be sellers to postpone putting their home on the market. Downsizers who may have moved into assisted living or nursing homes are staying in place instead. But there are other factors as well.
For more than a decade, less new construction has been built relative to historical averages, particularly in the suburbs. Interest rates have also been a factor. Windermere Chief Economist Matthew Gardner noted, “I think a lot of the urgency from buyers is due to rising mortgage rates and the fear that rates are very unlikely to drop again as we move through the year, which is a safe assumption to make.” Homeowners who refinanced when rates were at record lows are staying in their homes longer, keeping more inventory off the market. And those same low interest rates have compelled many homeowners who bought a new home not to sell their previous one, but to keep it as a rental property.
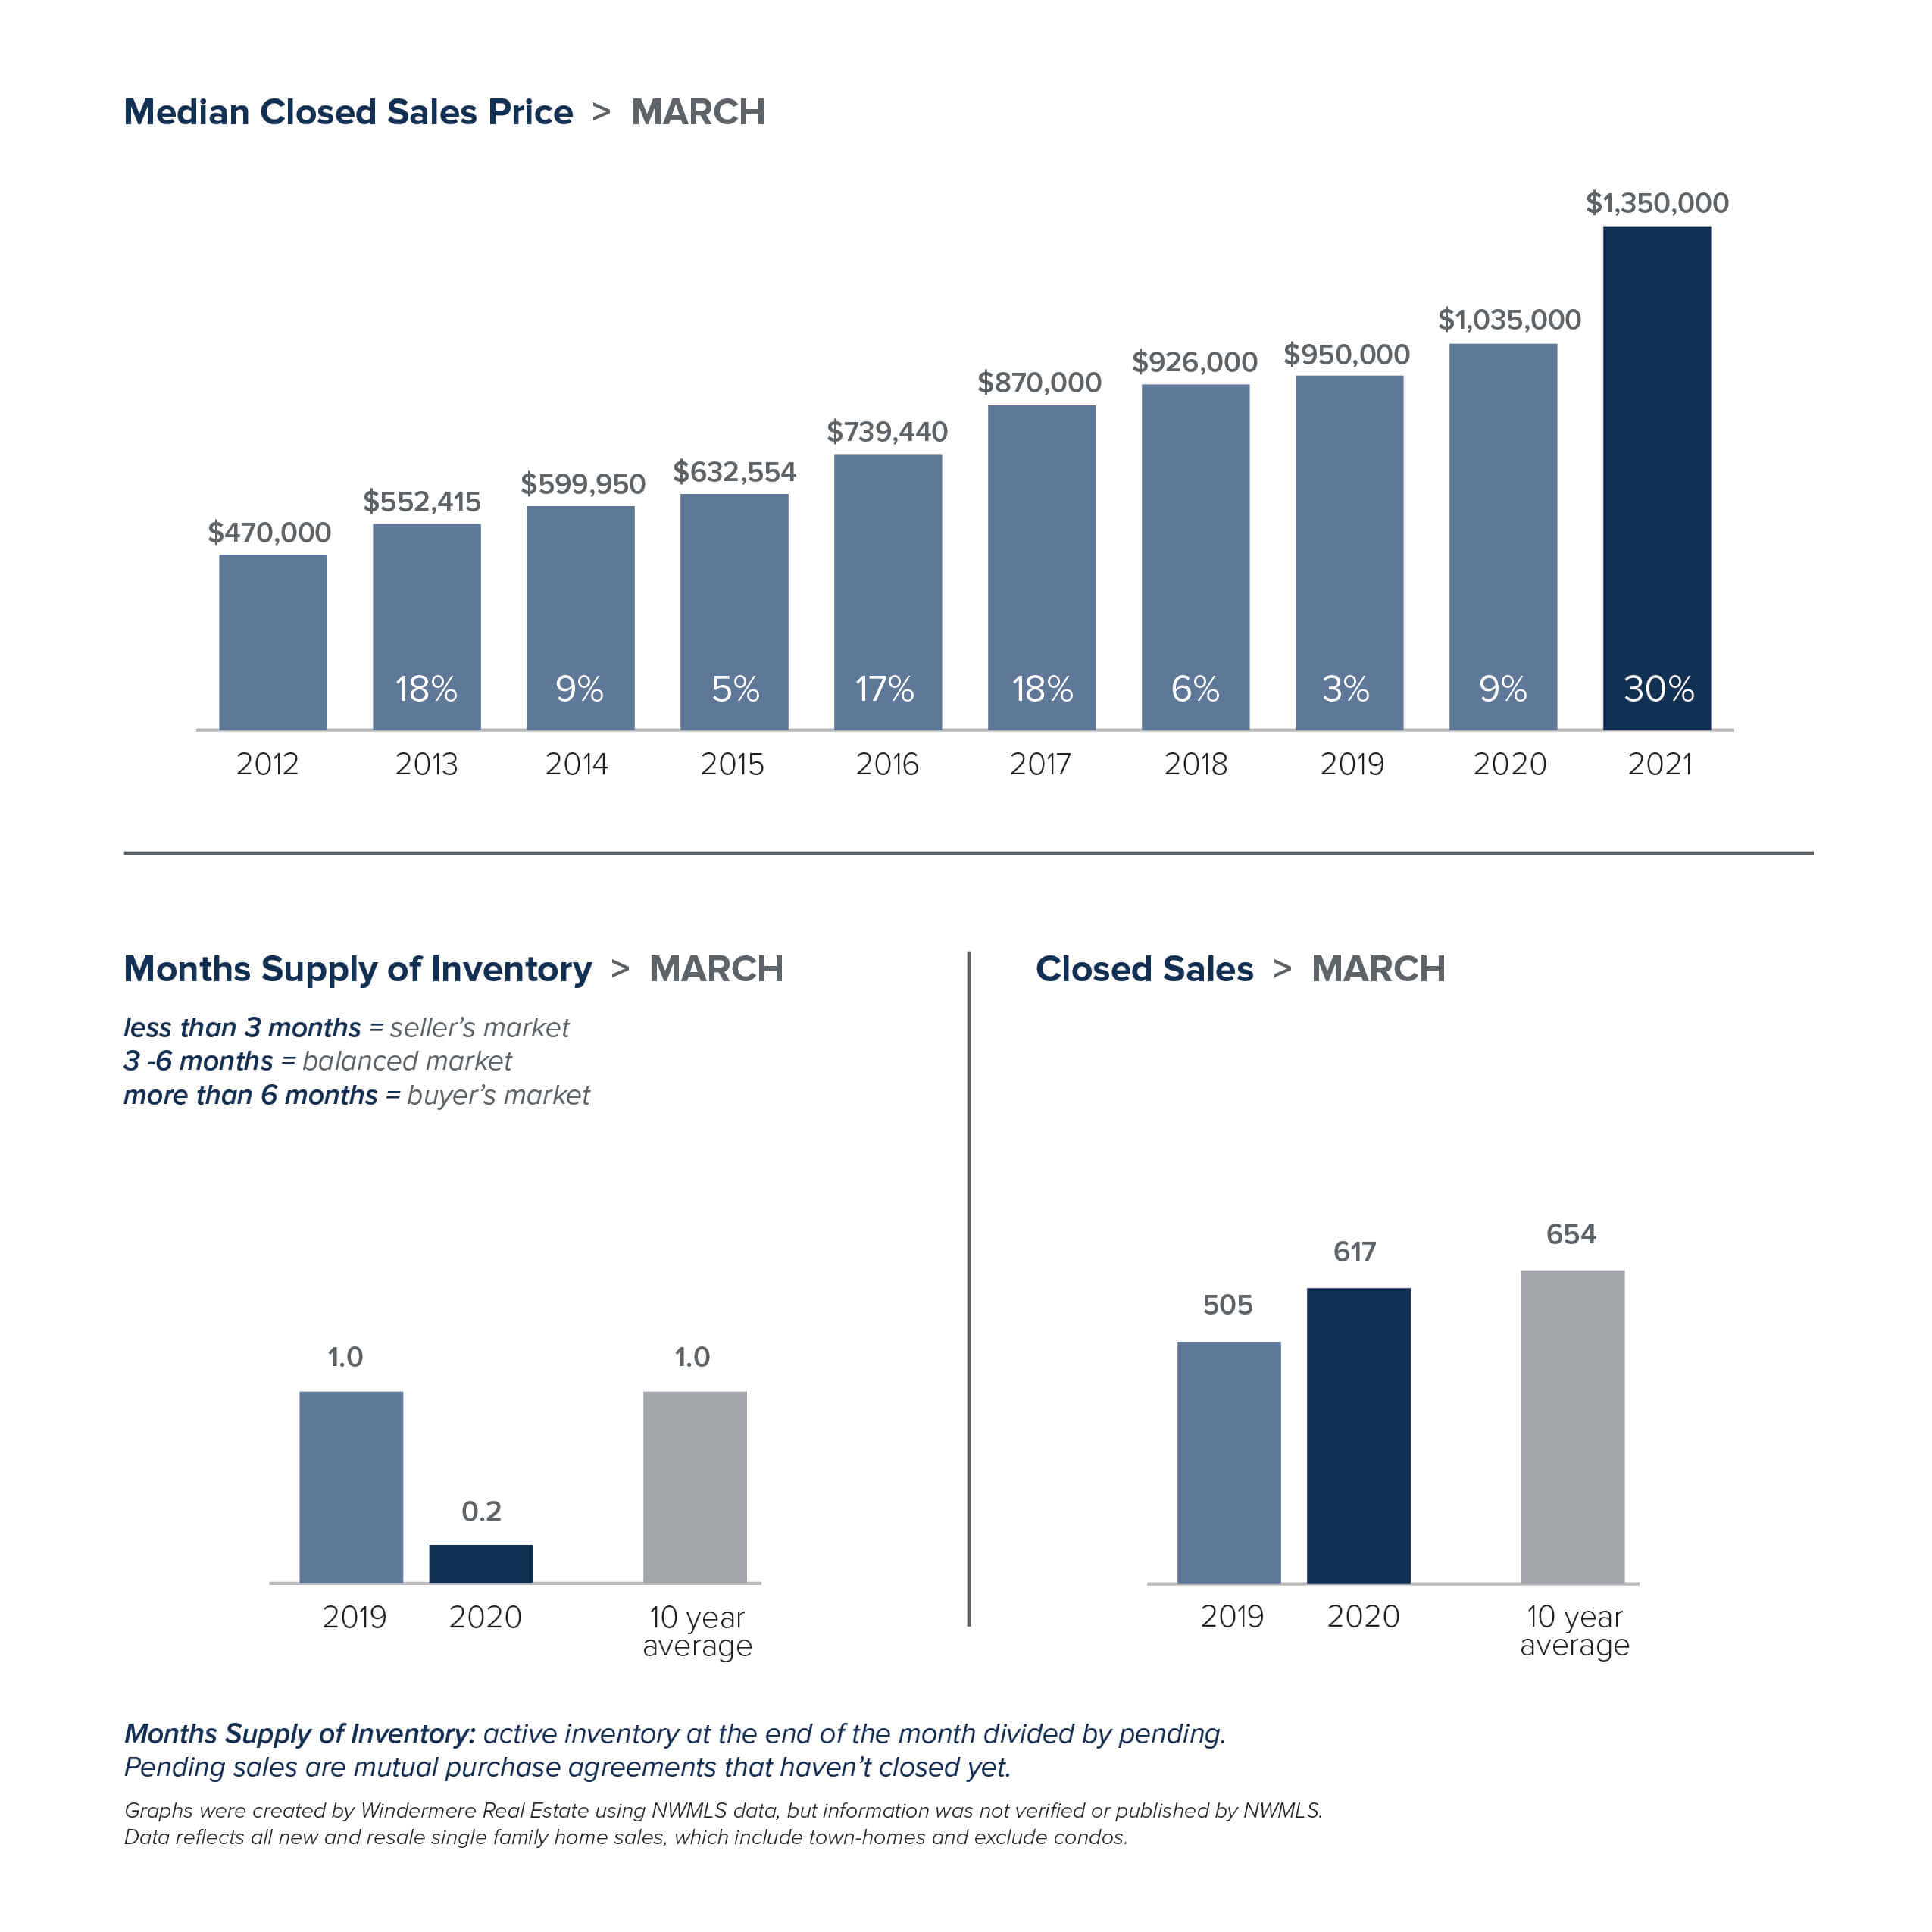
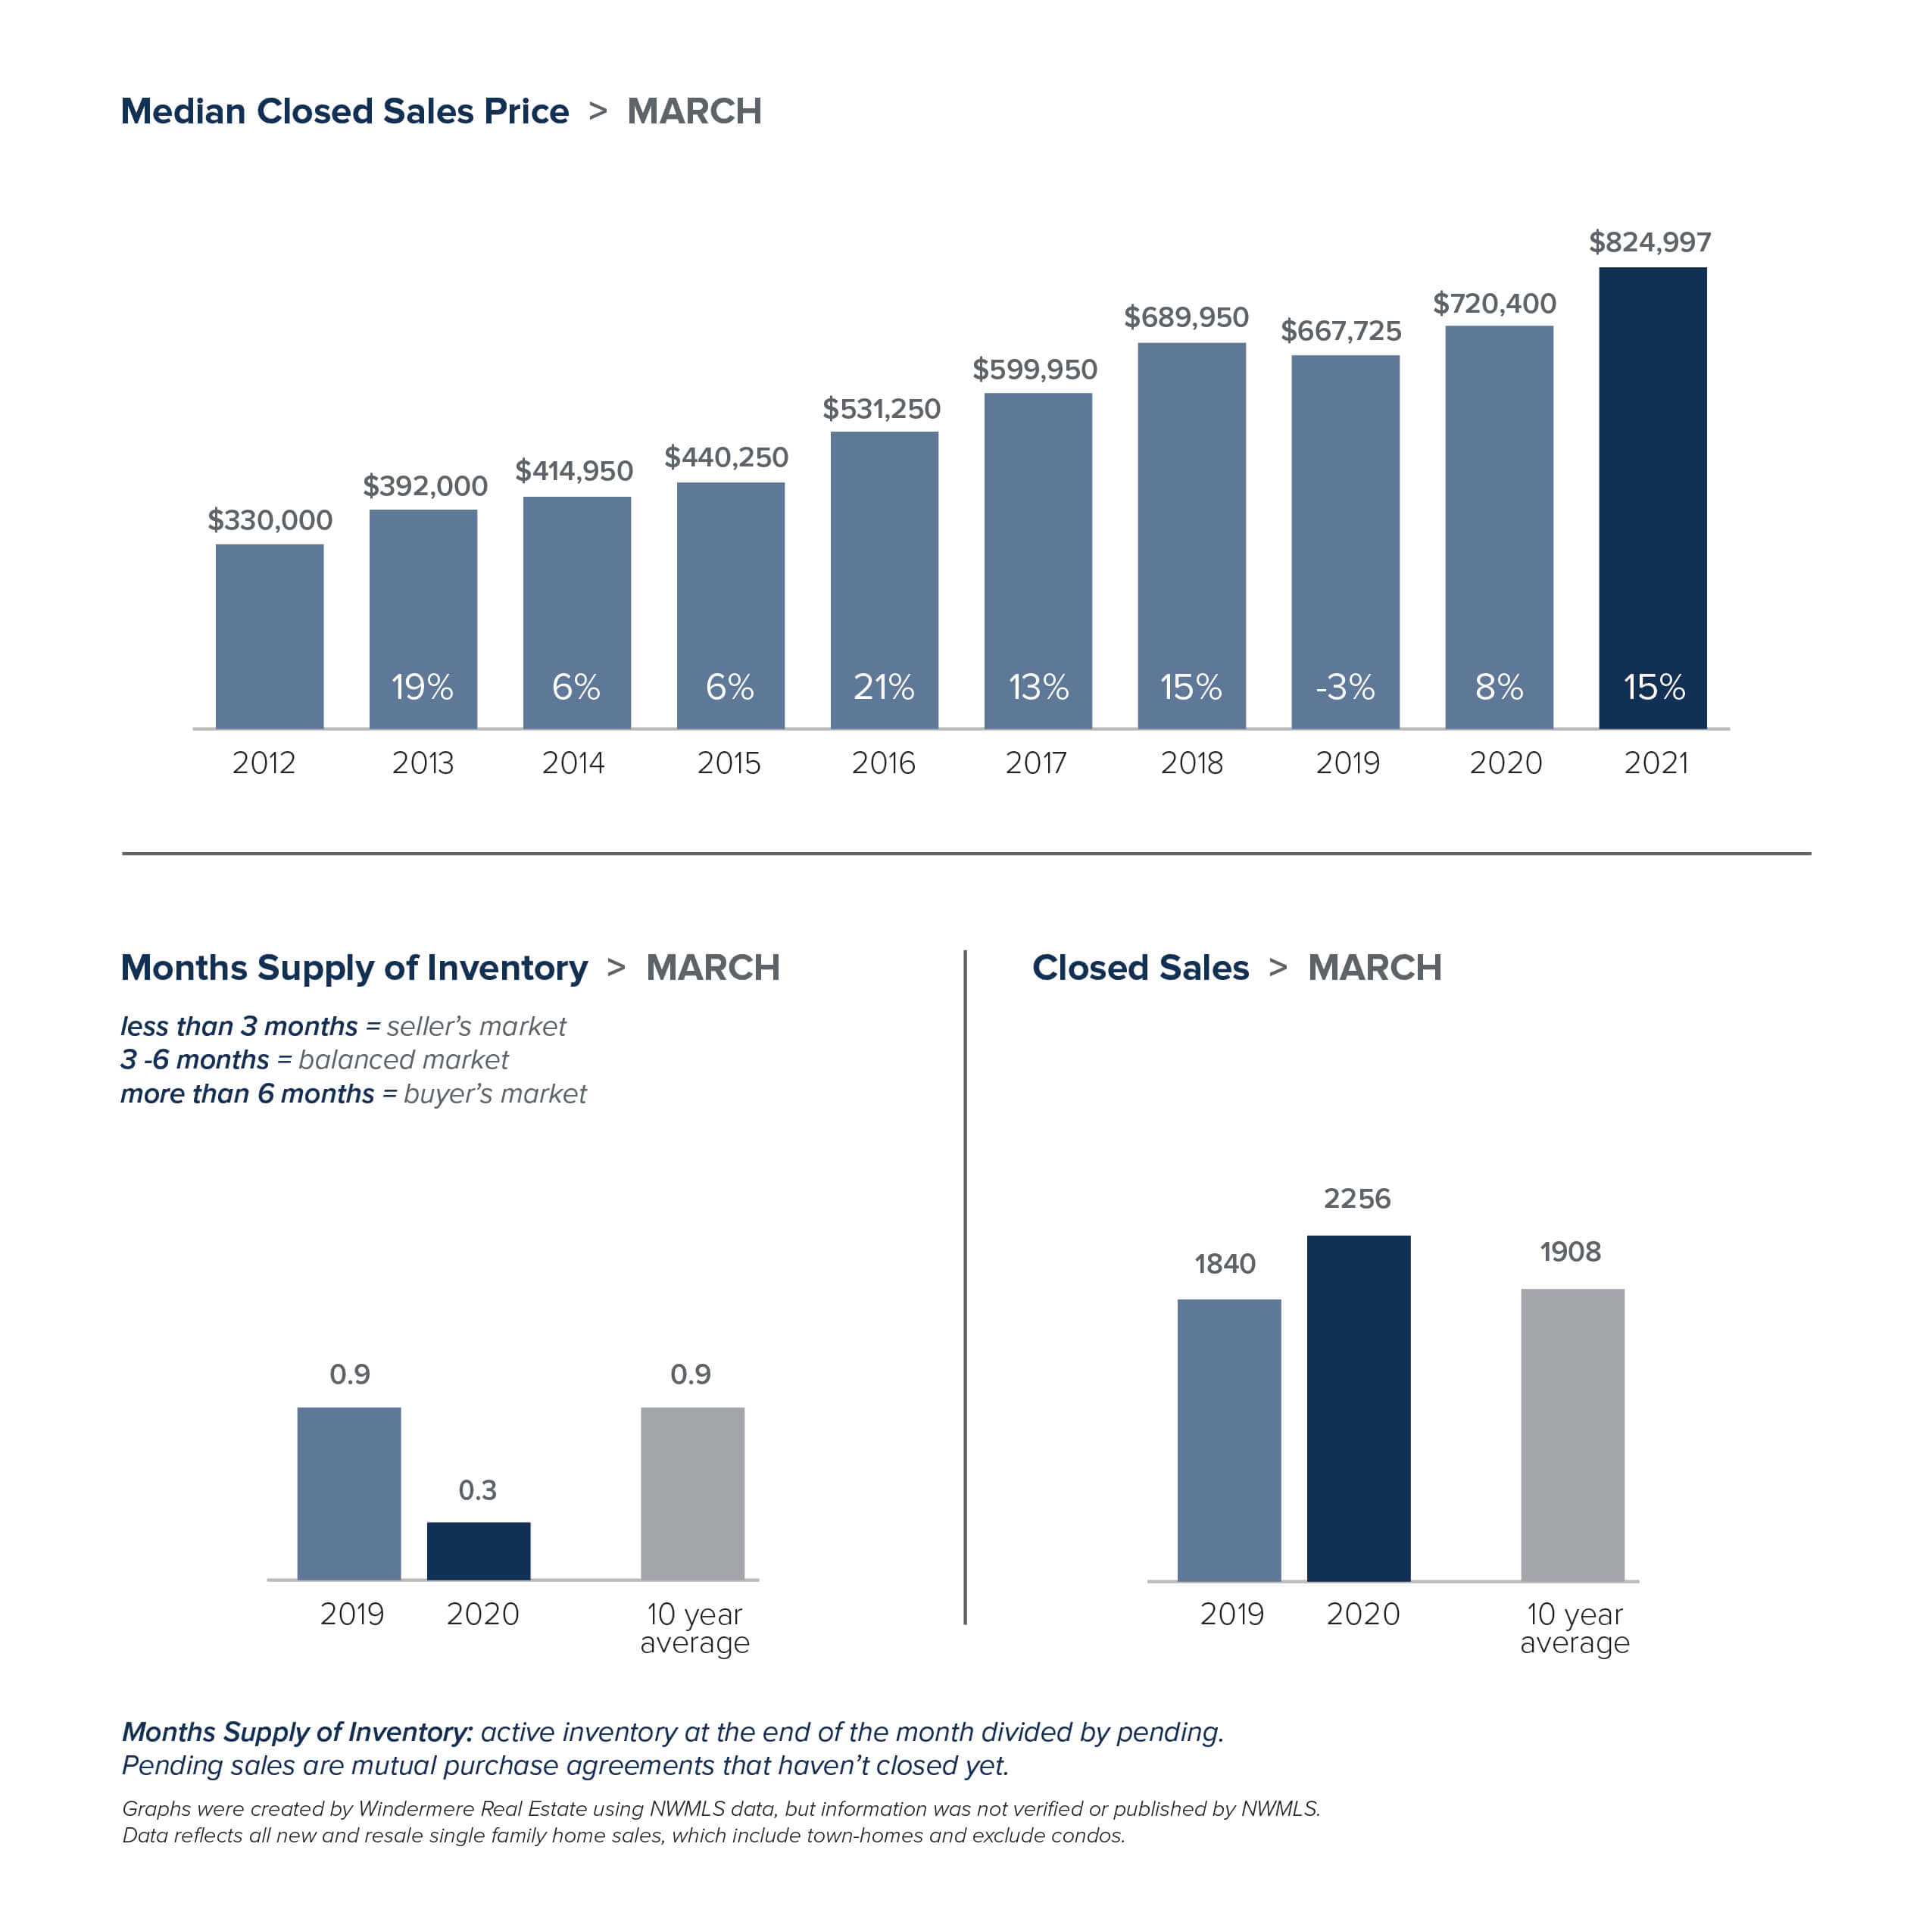
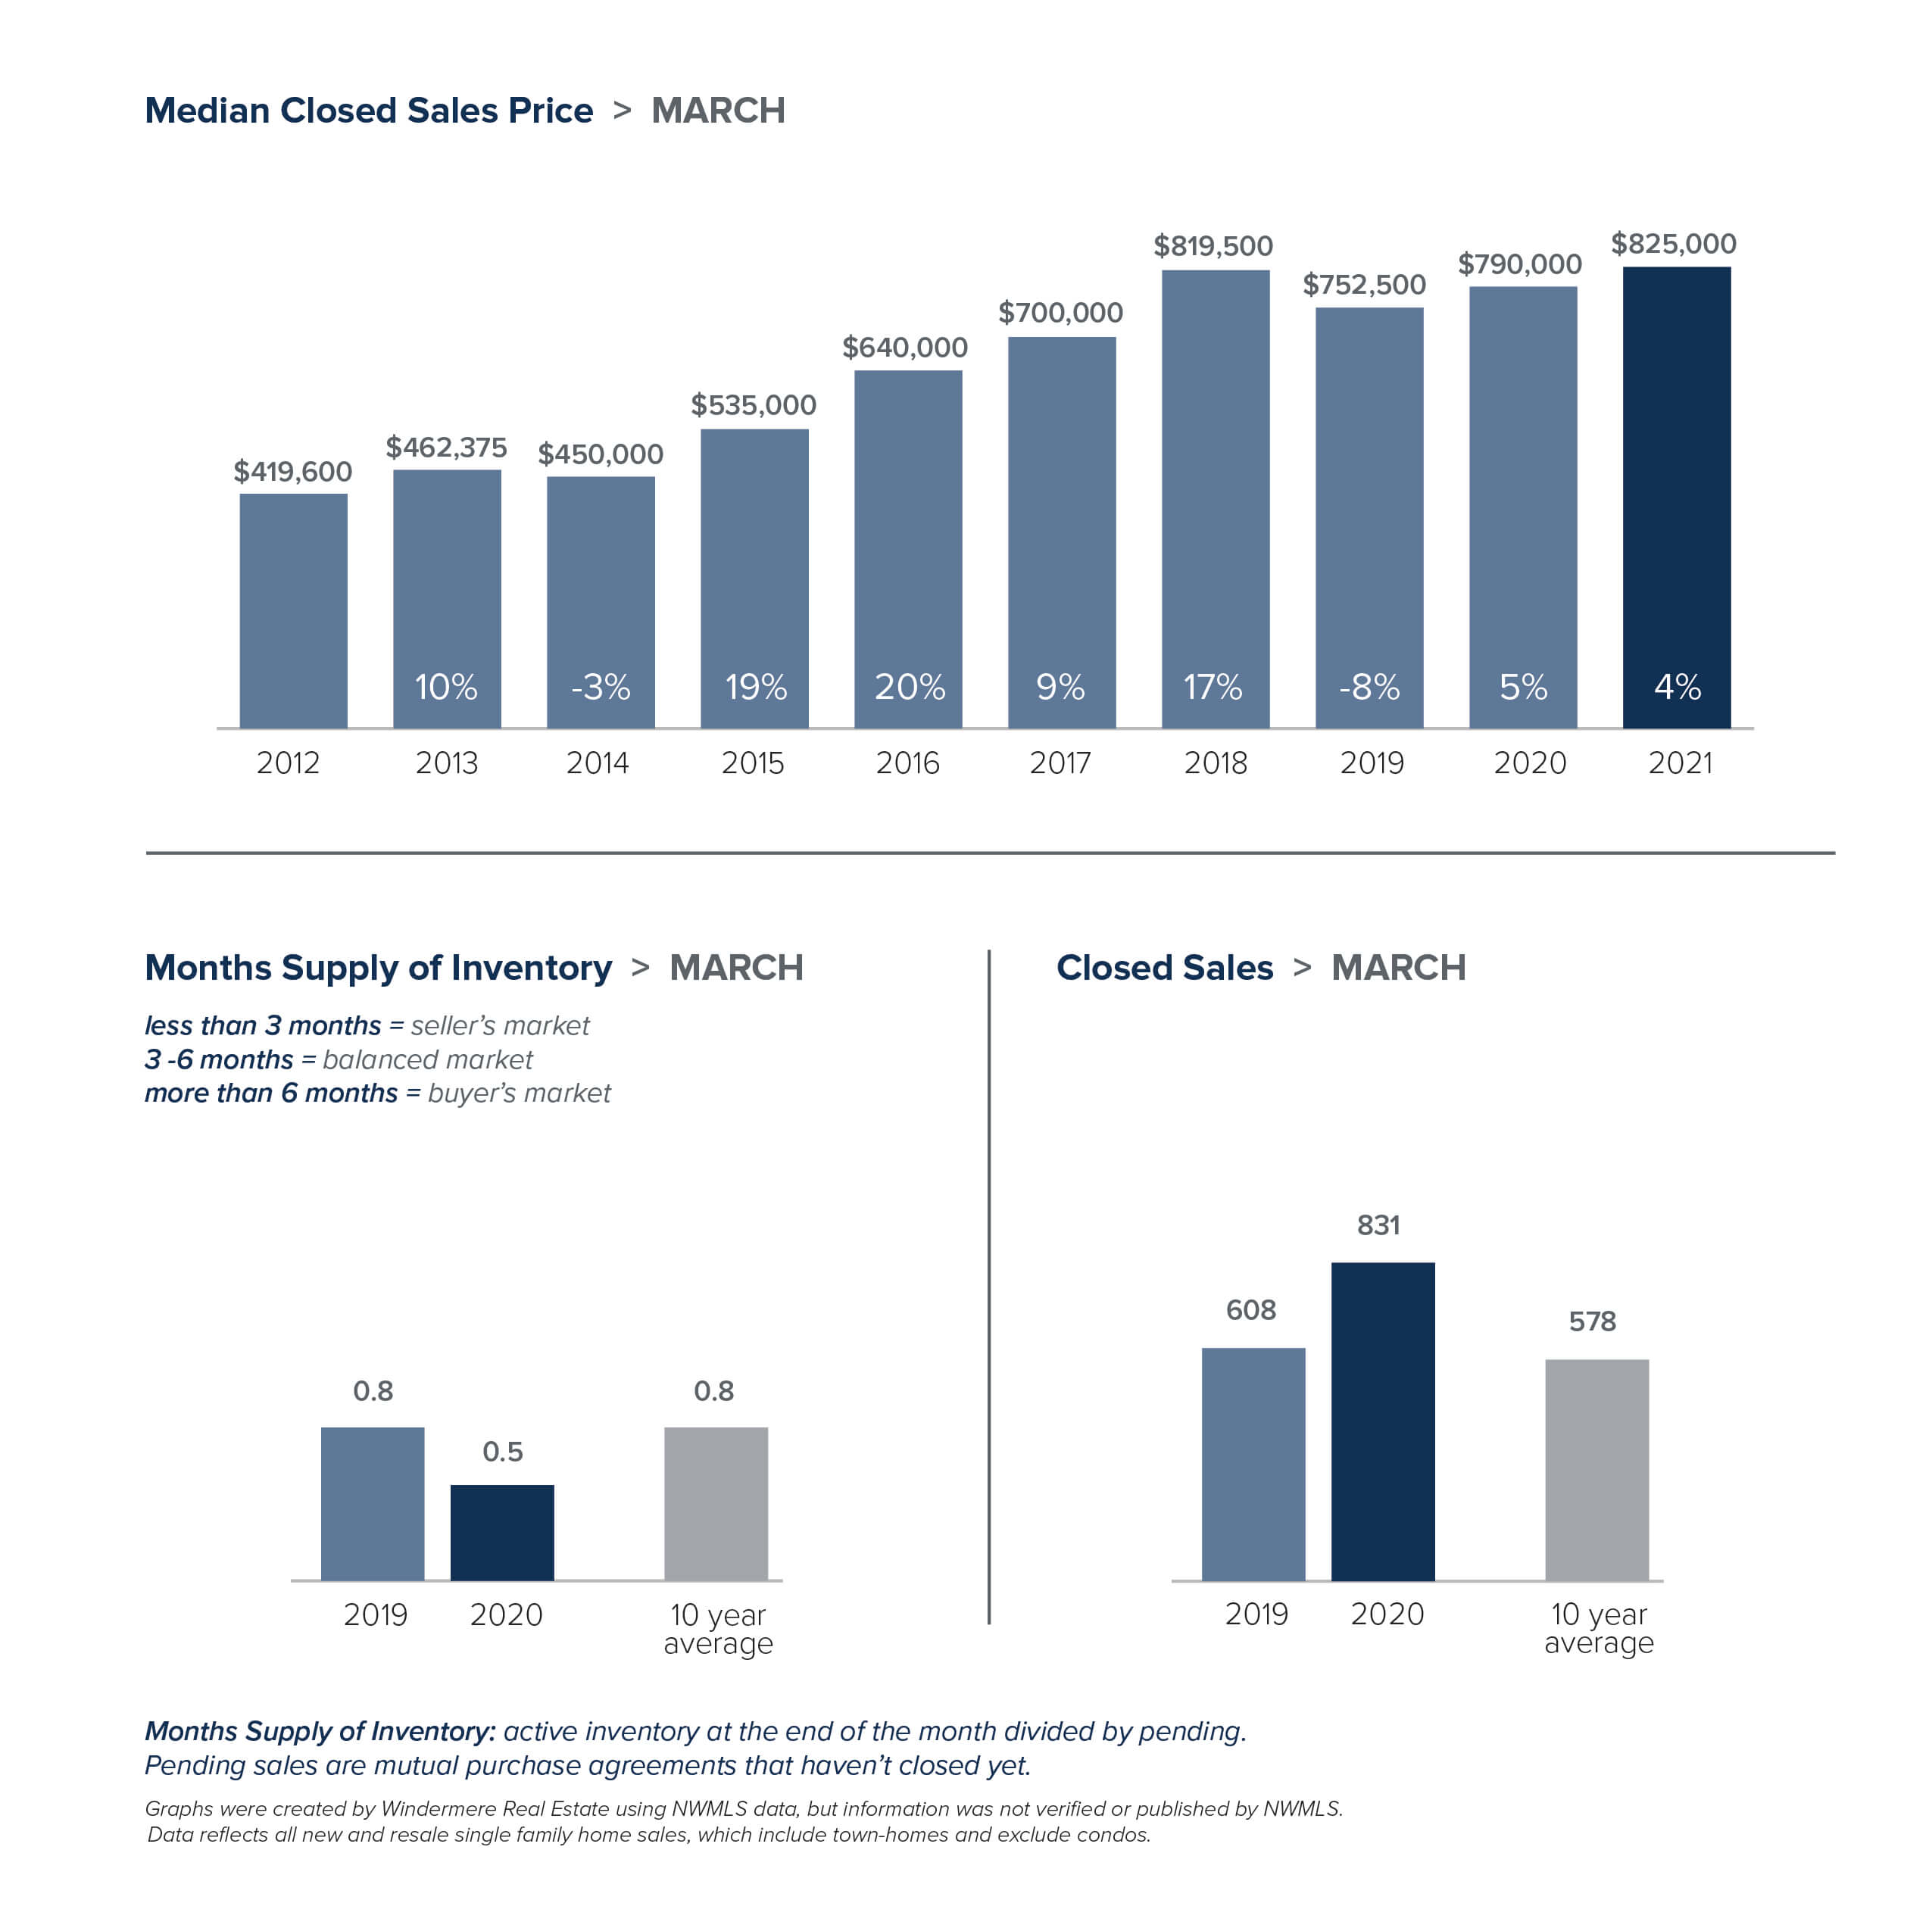
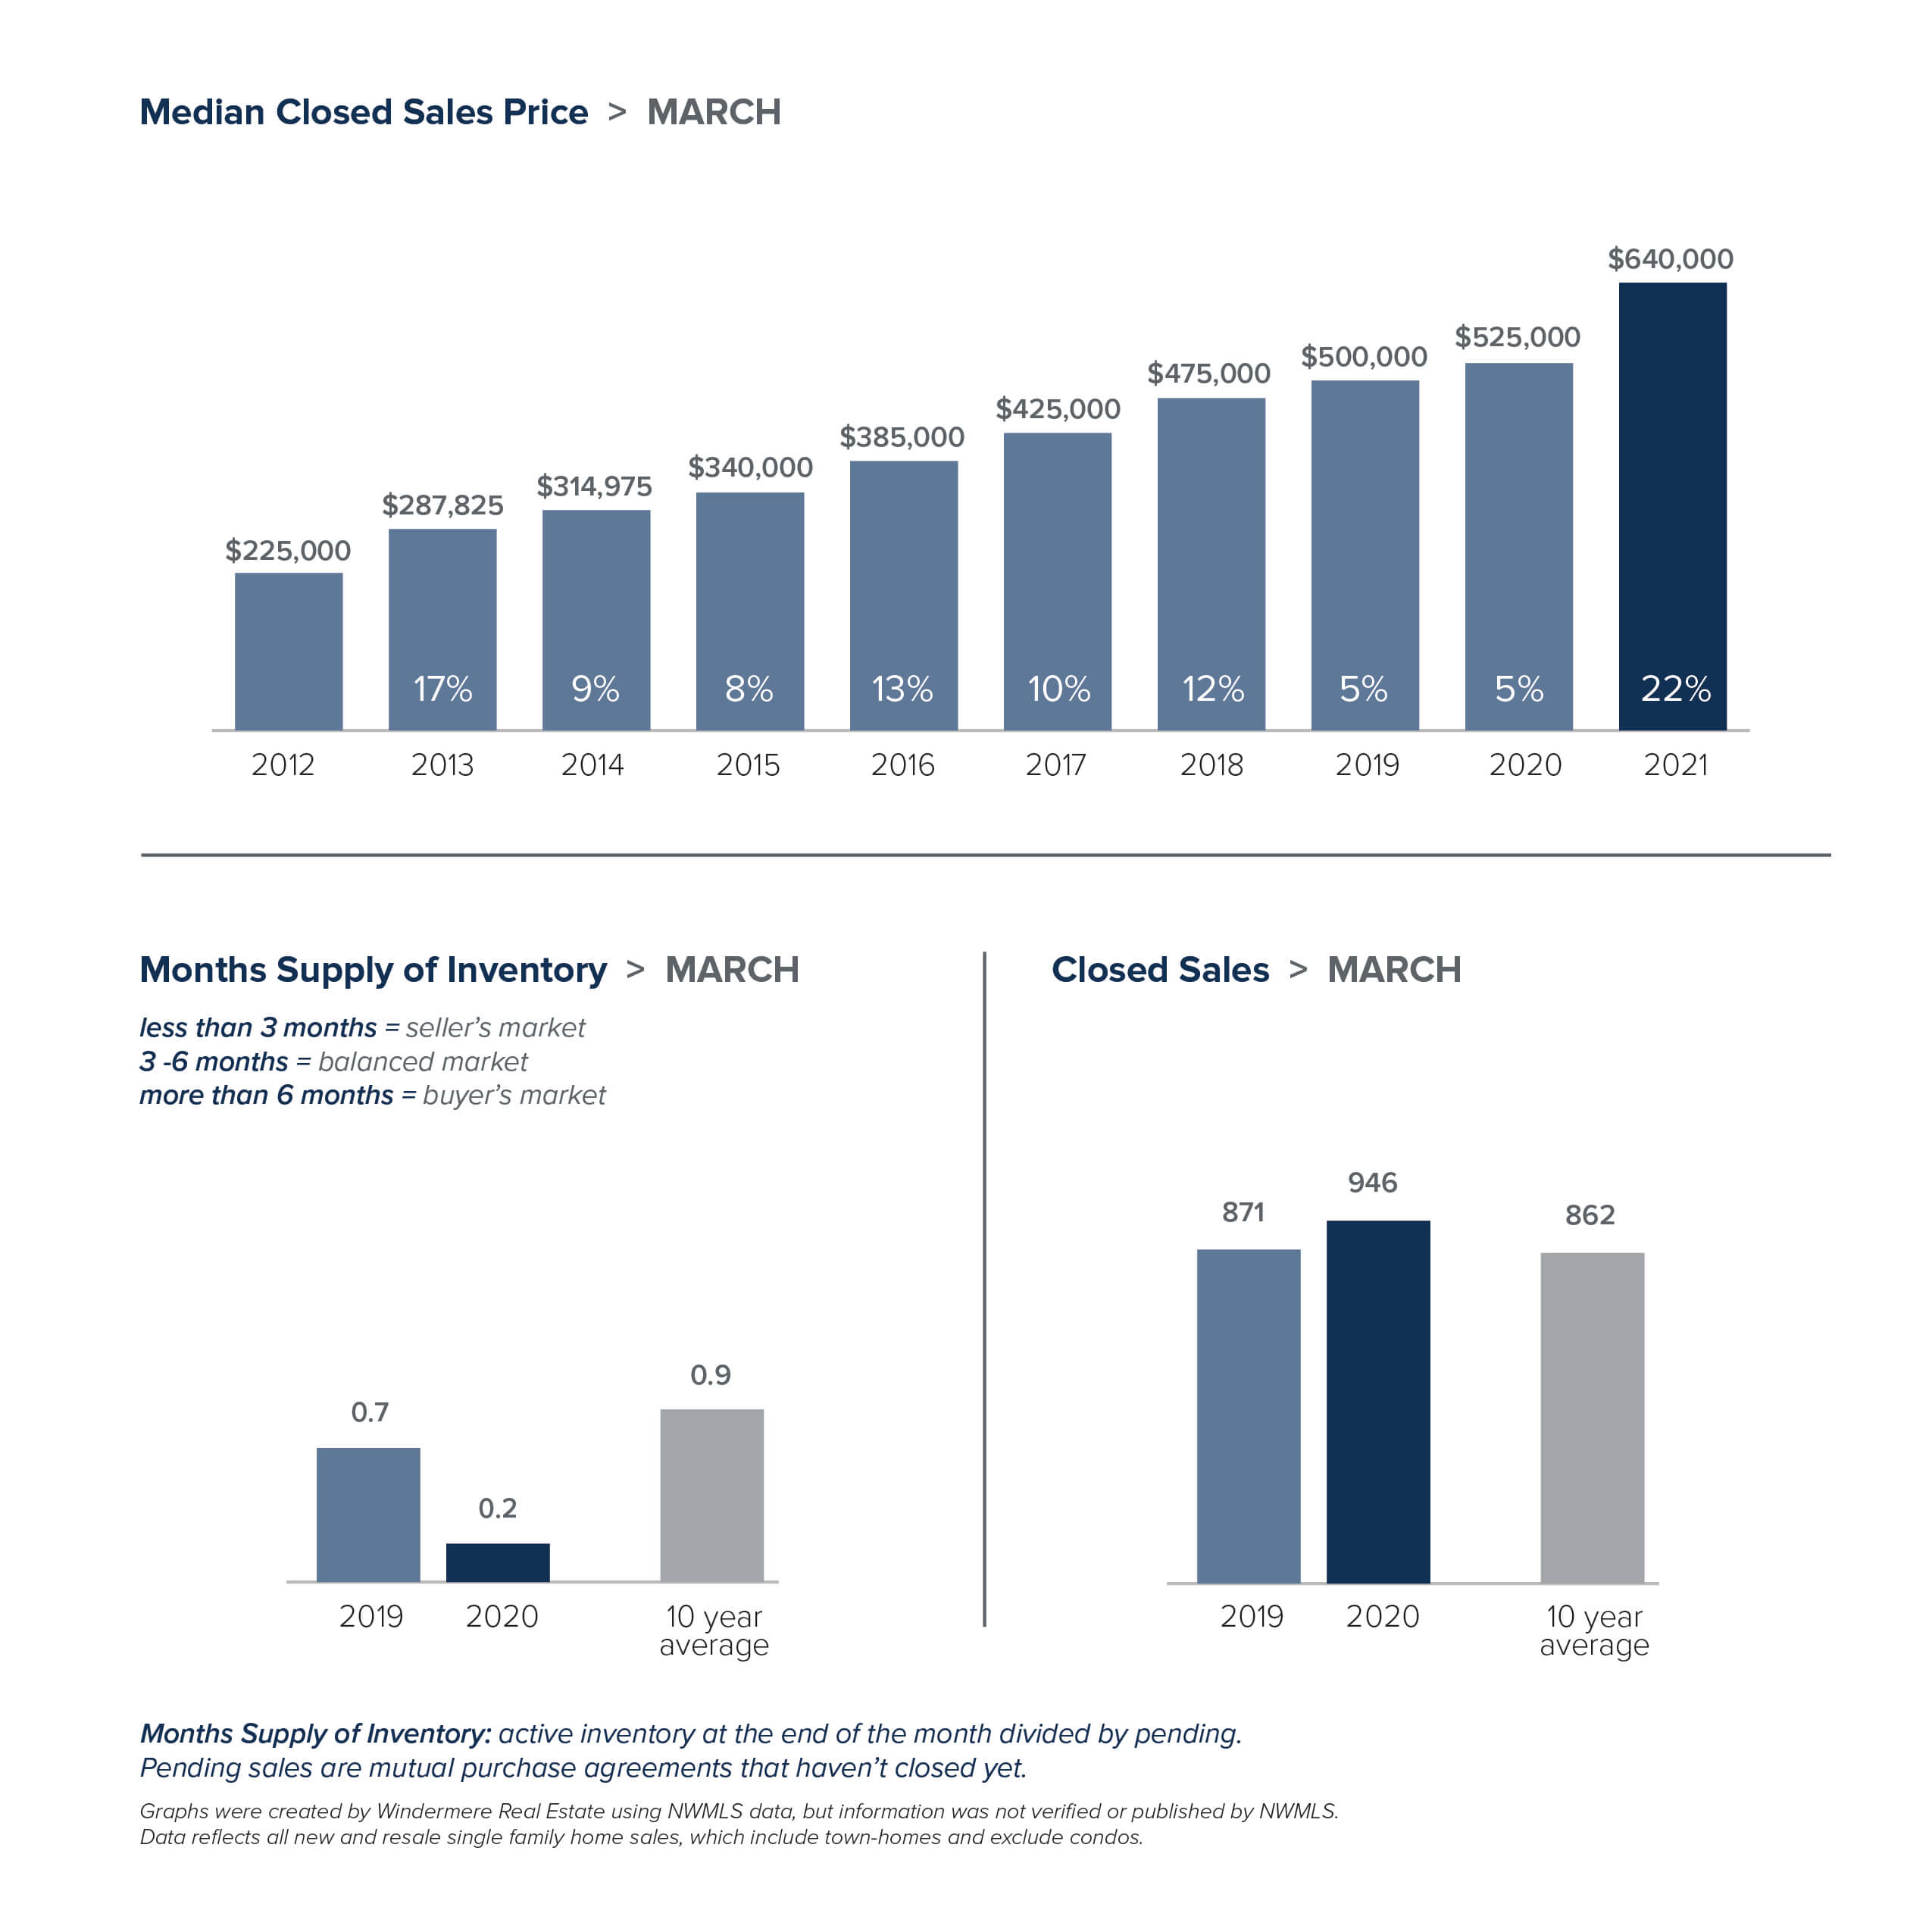
While the number of listings tanked, the number of sales skyrocketed. That’s the recipe for soaring home prices. Housing prices here have been growing at the second-fastest rate in the nation for a full year. Nearly every area of King County saw double-digit price increases, with the exception of Seattle. In King County the median price for a single-family home in March was a record-high $825,000, up 15% from a year ago and an increase of 10% from February. The median home price topped $1 million for every city on the Eastside, where the overall median price surged 30% to $1,350,000, the highest median price ever recorded for the area. Seattle homes prices were also record-breaking, rising 4% to $825,000. Snohomish County prices set yet another all-time high as the median home price jumped 22% to $640,000.
The appeal of our area just keeps growing. For the second time, Washington took the No. 1 spot in the U.S. News Best States ranking – the first state to earn the top ranking twice in a row. The bottom line: the local real estate market is extremely competitive, and it shows no signs of slowing down. Successfully navigating today’s market takes a strong plan. Your broker can work with you to determine the best strategies for your individual situation.
The charts below provide a brief overview of market activity. If you are interested in more information, every Monday Windermere Chief Economist Matthew Gardner provides an update on the US economy and housing market. You can get Matthew’s latest update here.
EASTSIDE
KING COUNTY
SEATTLE
SNOHOMISH COUNTY
VIEW FULL SNOHOMISH COUNTY REPORT
This post originally appeared on GettheWReport.com
Local Market Update – February 2021
This winter’s real estate market is looking more like a typical spring market. Sales were up, competition was fierce and prices continued to rise.
Lack of inventory still presents a huge issue. At the end of January there were only 1,055 single-family homes on the market in all of King County, 33% fewer than a year ago. If that wasn’t tight enough, Snohomish County had only 298 single-family homes for sale, 63% fewer than a year ago. Condos remain a bright spot for buyers frustrated by the frenzied market. January saw a nearly 50% increase in the number of condos for sale in King County. However, the increase in inventory didn’t translate into a drop in price. The median condo price was flat for the county, up 10% in Seattle and up 7% on the Eastside. Those looking for a relative bargain should consider Southwest and Southeast King County where the median condo prices were $254,275 and $269,900 respectively.
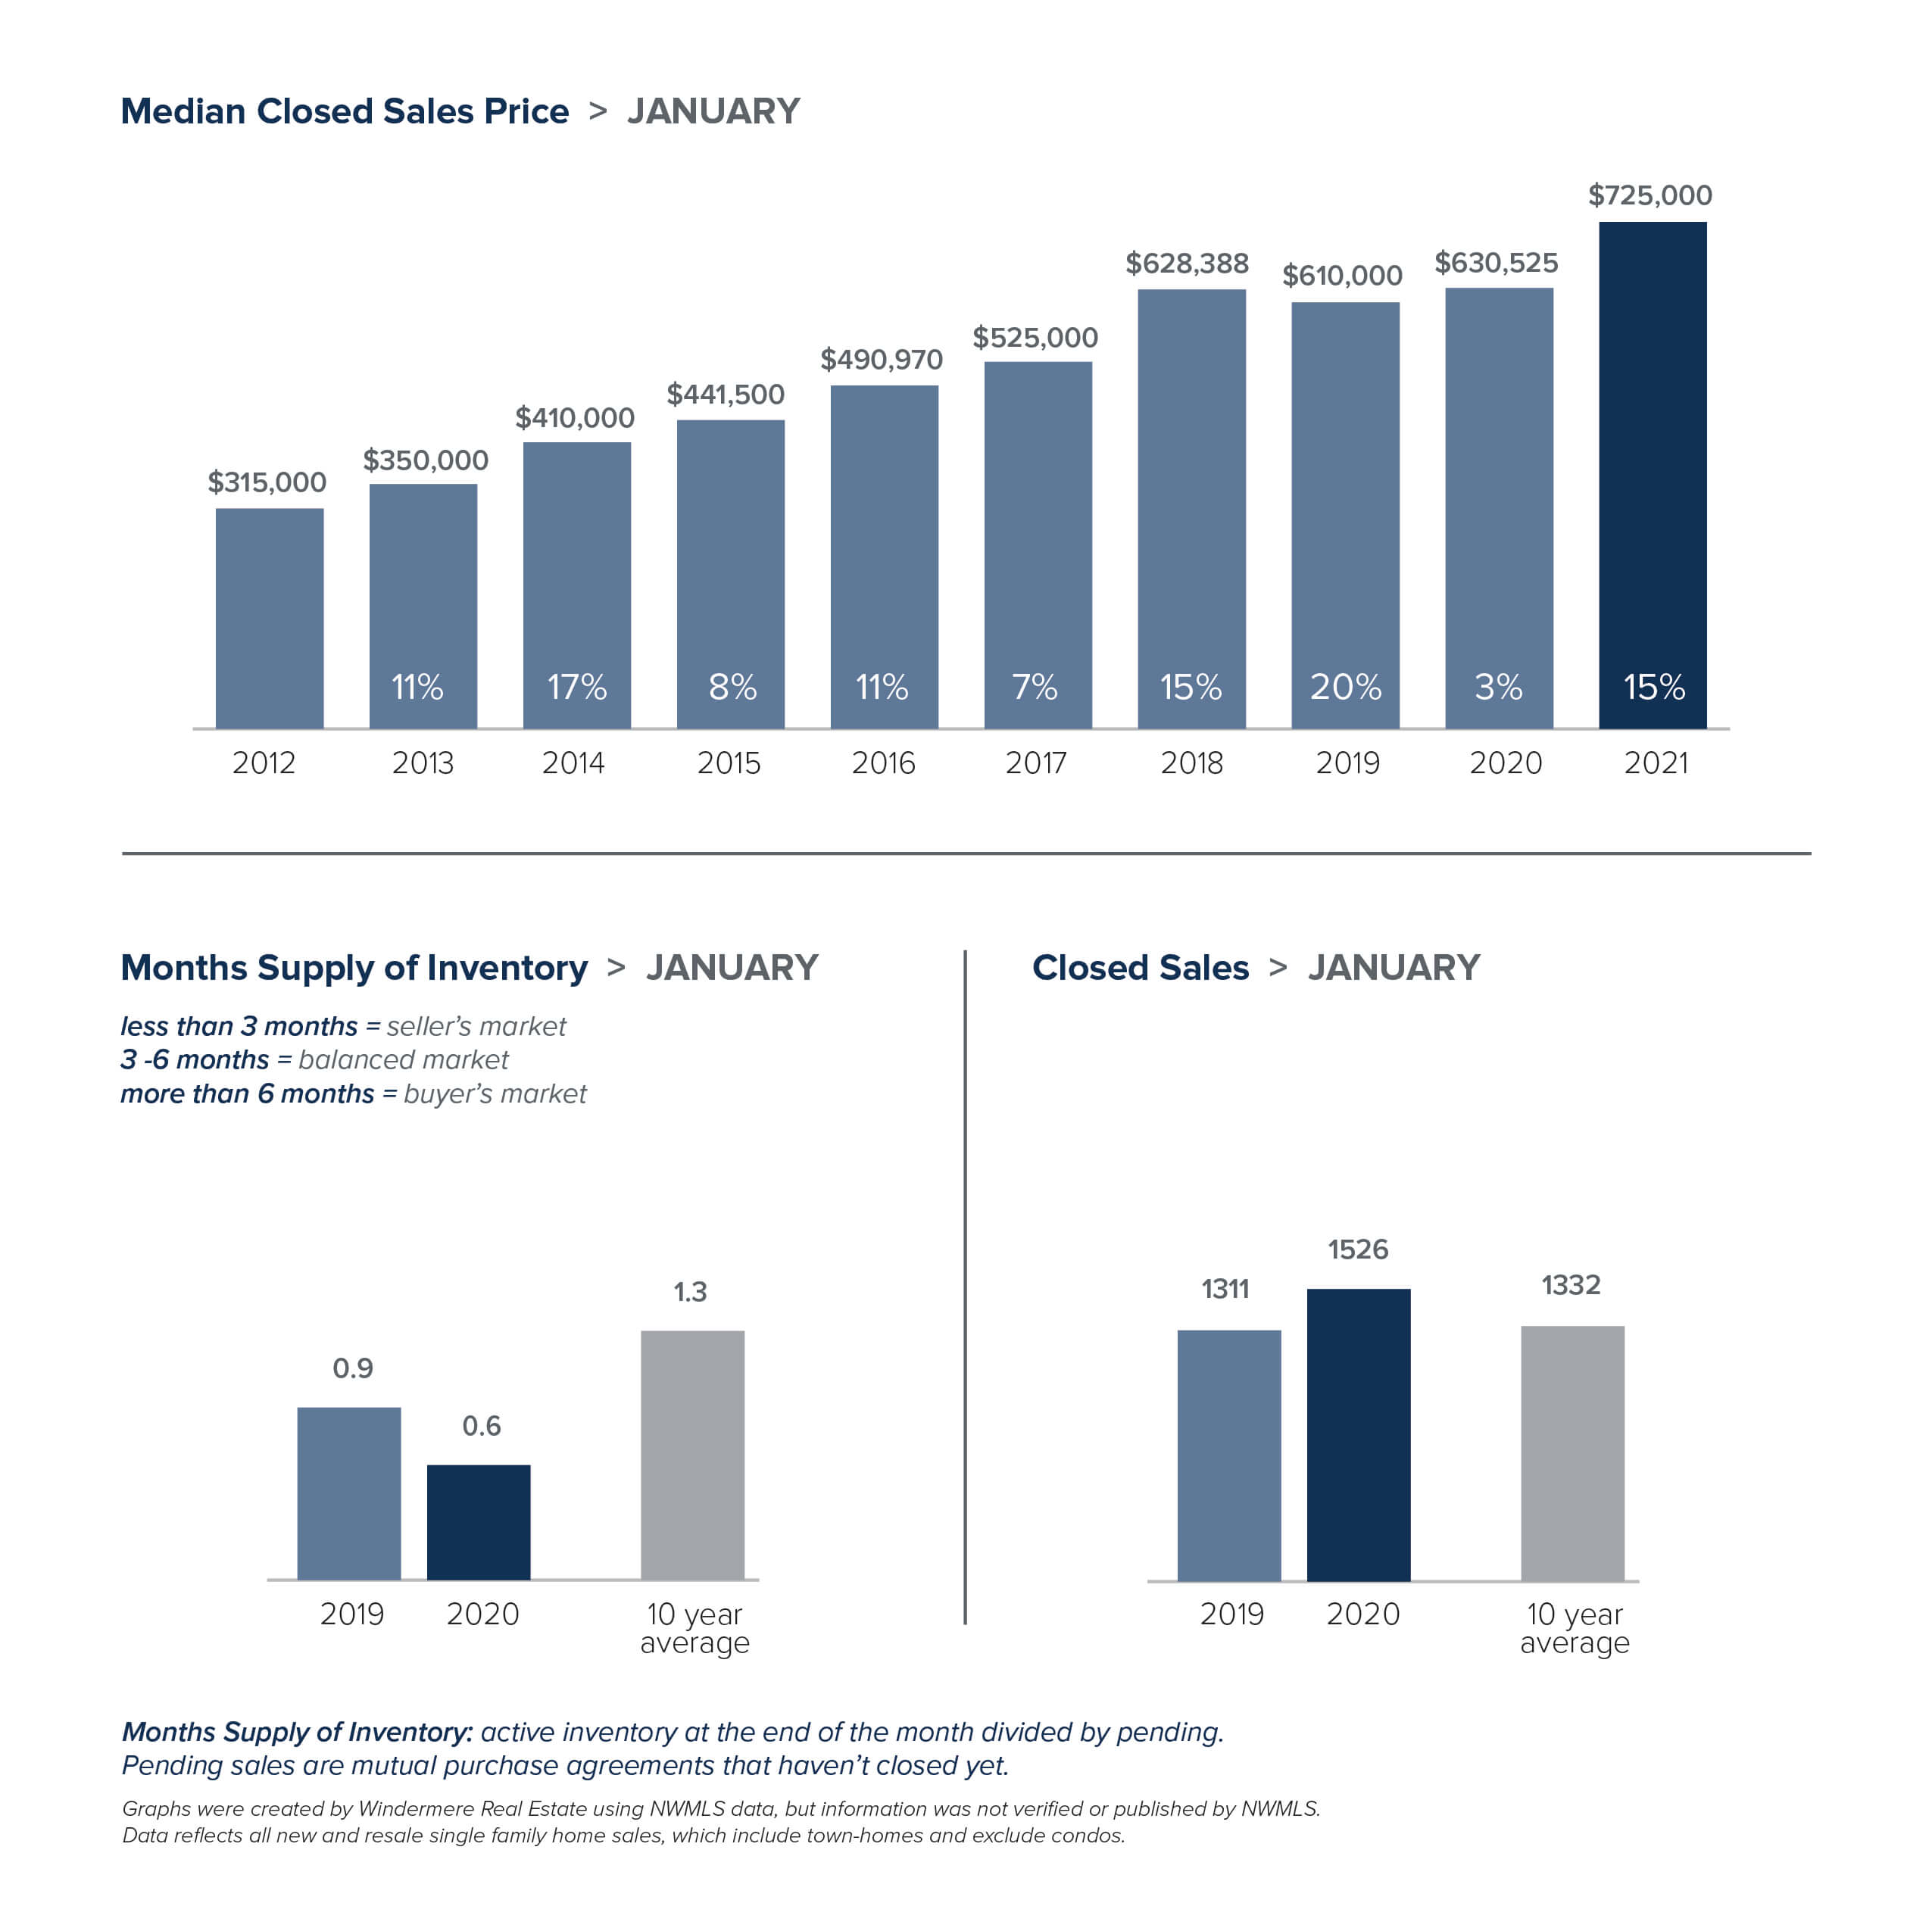
The large imbalance between supply and demand sent prices higher. Home prices here are climbing at the second-fastest rate in the nation. The median price of a single-family home in King County was $725,000, a 15% jump from a year ago. Seattle home prices increased 10% to $791,471. Inventory on the Eastside was down 58%, sending the median home price soaring 29% to $1.15 million. Snohomish County saw prices rise 18% to $599,990, well surpassing its previous high of $575,000.
While low interest rates take some of the sting out of rising prices, multiple offers over asking price have become the norm and are expected to continue. The easing of COVID restrictions may add yet more competition. Both King and Snohomish counties have moved into Phase 2 of the Healthy Washington plan, which allows open houses to resume with up to 10 people socially distanced.
All signs point to this strong seller’s market continuing for some time. The person who represents you as a buyer can make the difference in owning a home or not. Brokers are advising buyers to create a plan that prioritizes their wish list and sets realistic expectations in this hyper-competitive market.
The charts below provide a brief overview of market activity. If you are interested in more information, every Monday Windermere Chief Economist Matthew Gardner provides an update regarding the impact of COVID-19 on the US economy and housing market. You can get Matthew’s latest update here.
EASTSIDE

KING COUNTY
SEATTLE

SNOHOMISH COUNTY

VIEW FULL SNOHOMISH COUNTY REPORT
This post originally appeared on GetTheWReport.com
Local Market Update – November 2020
The number of people who can work remotely may be changing the way we view our homes, but one trend has not changed. The local housing market in October remained unseasonably hot. And that doesn’t show signs of changing any time soon.
October saw continued low inventory and record-level sales, with the number of sales exceeding that of 2019 year-to-date.
While new listings are on the rise, they are being snapped up quickly and many homes are selling in a matter of days. In King County there were 38% fewer single-family homes on the market as compared to a year ago. Snohomish County had 59% fewer listings. A four-month supply of homes for sale is considered a balanced market, but King and Snohomish counties currently have less than one month of supply.
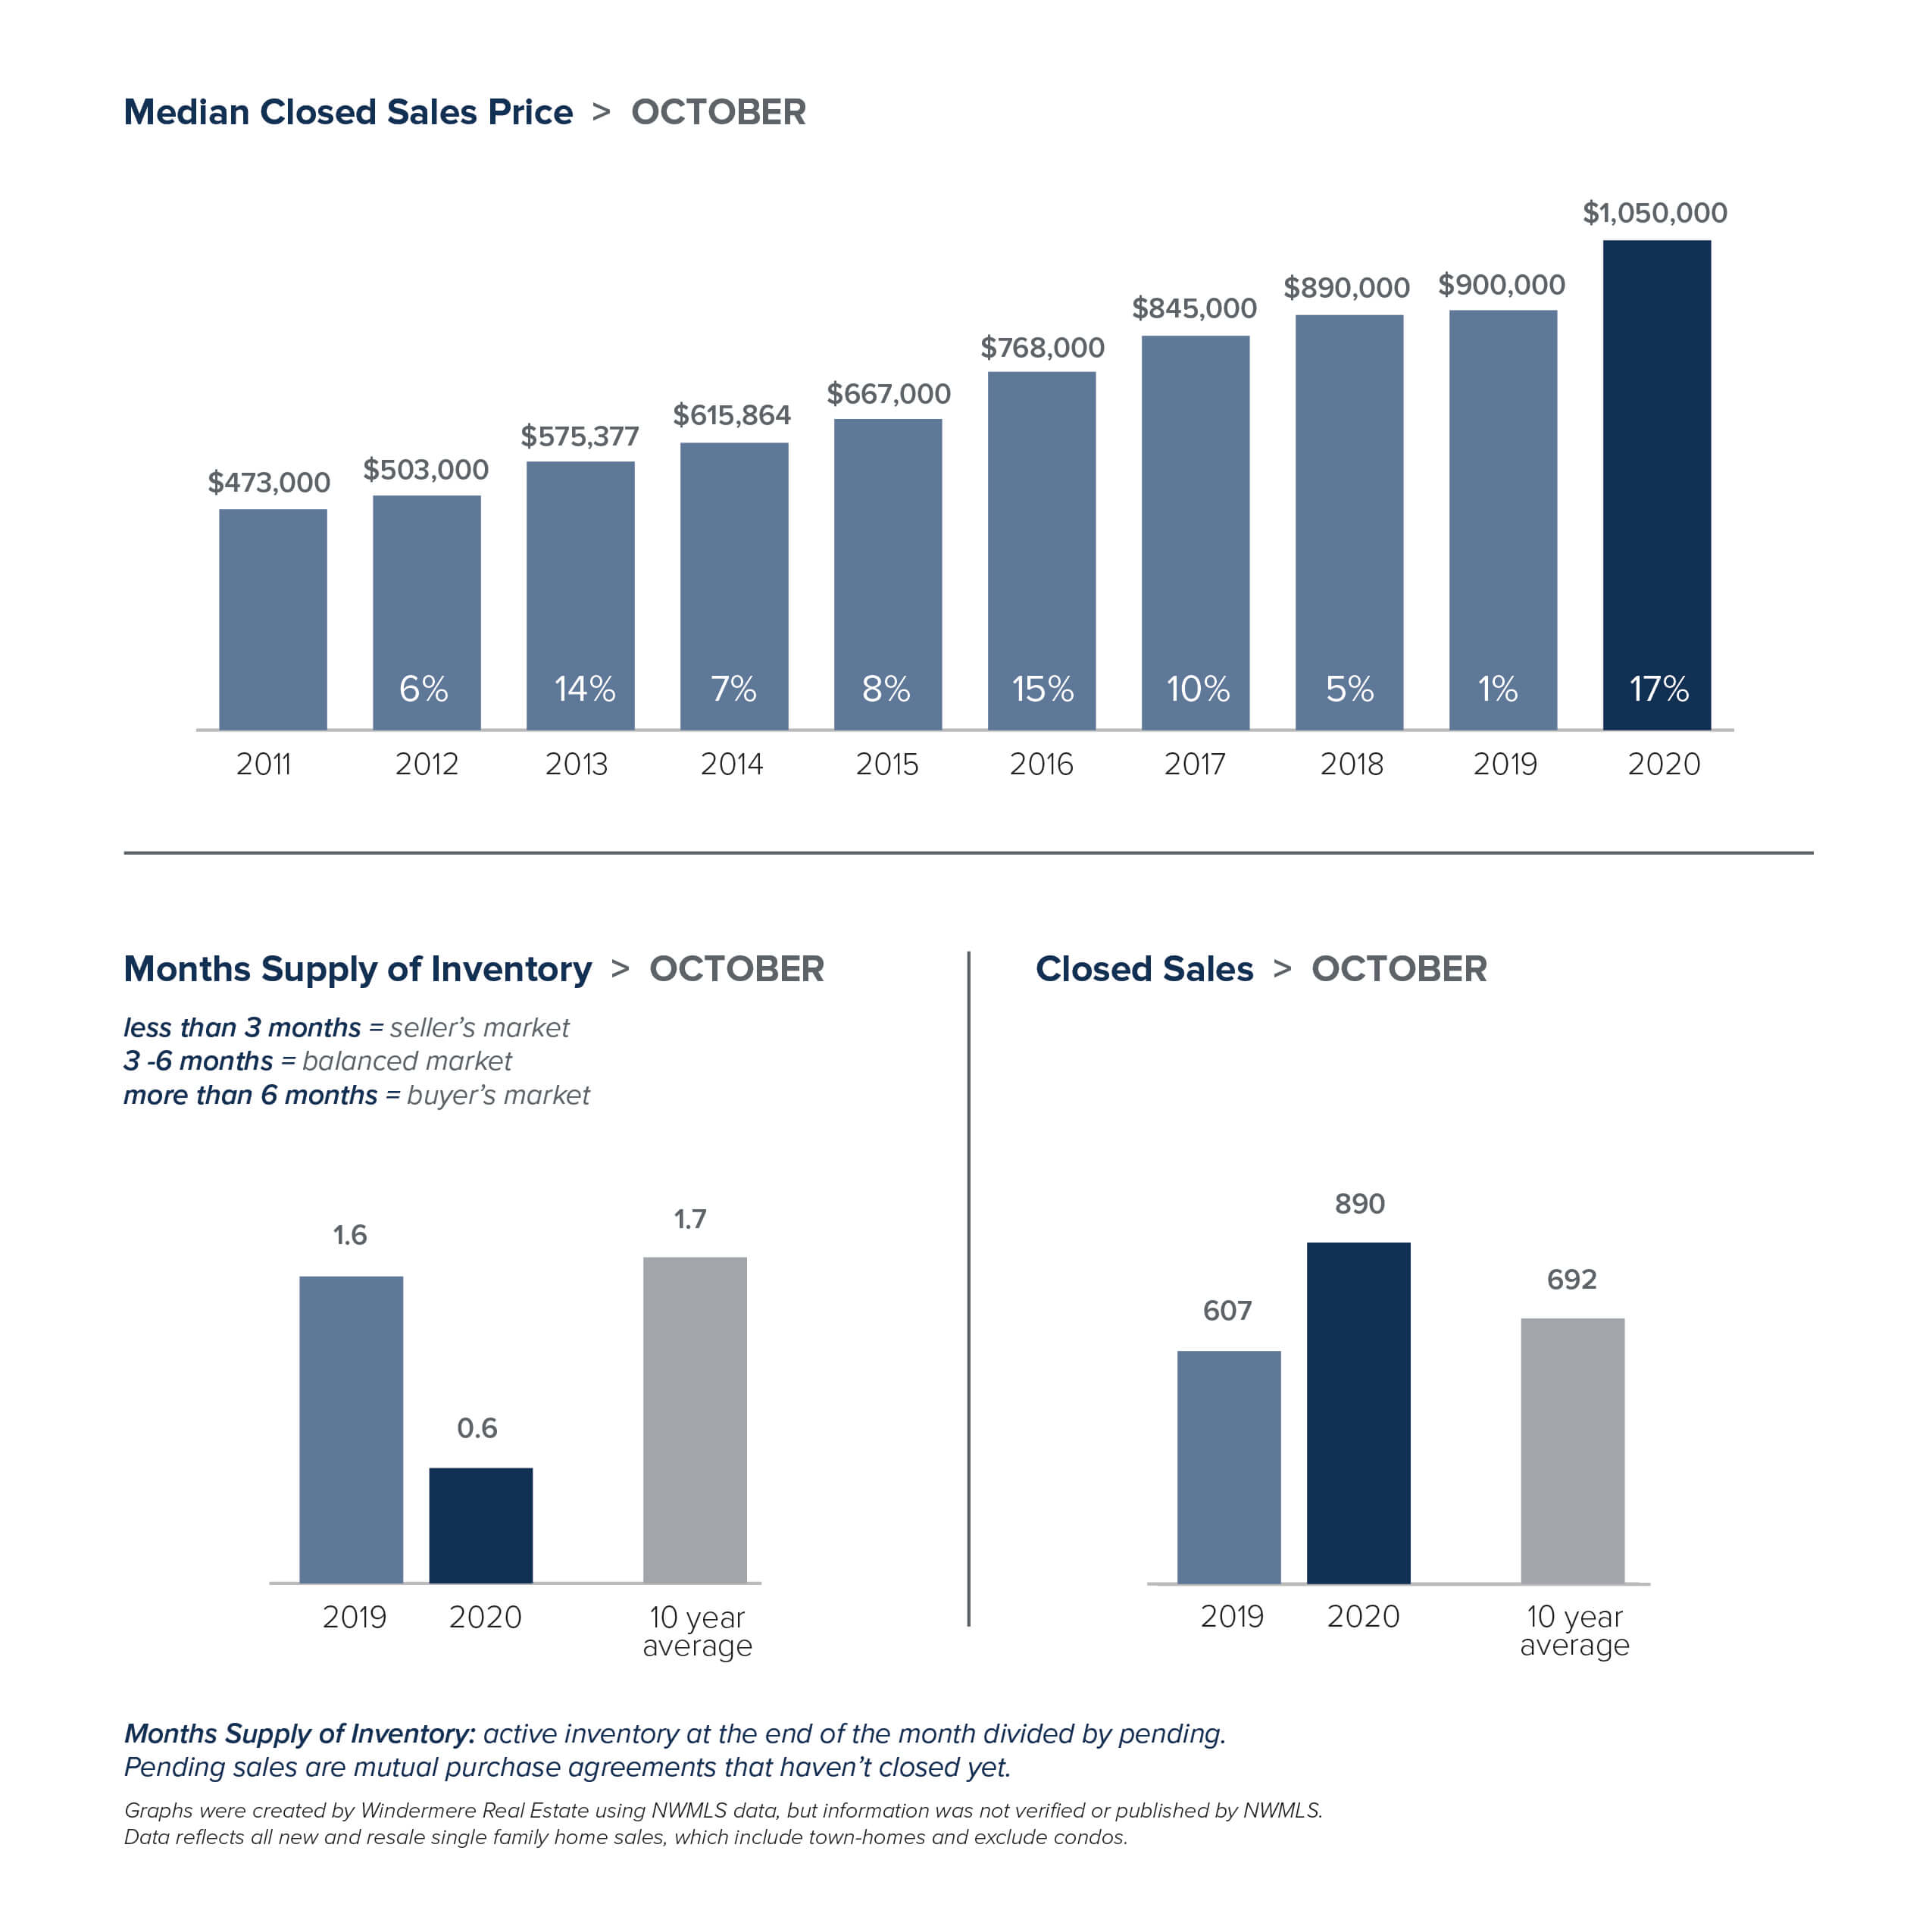
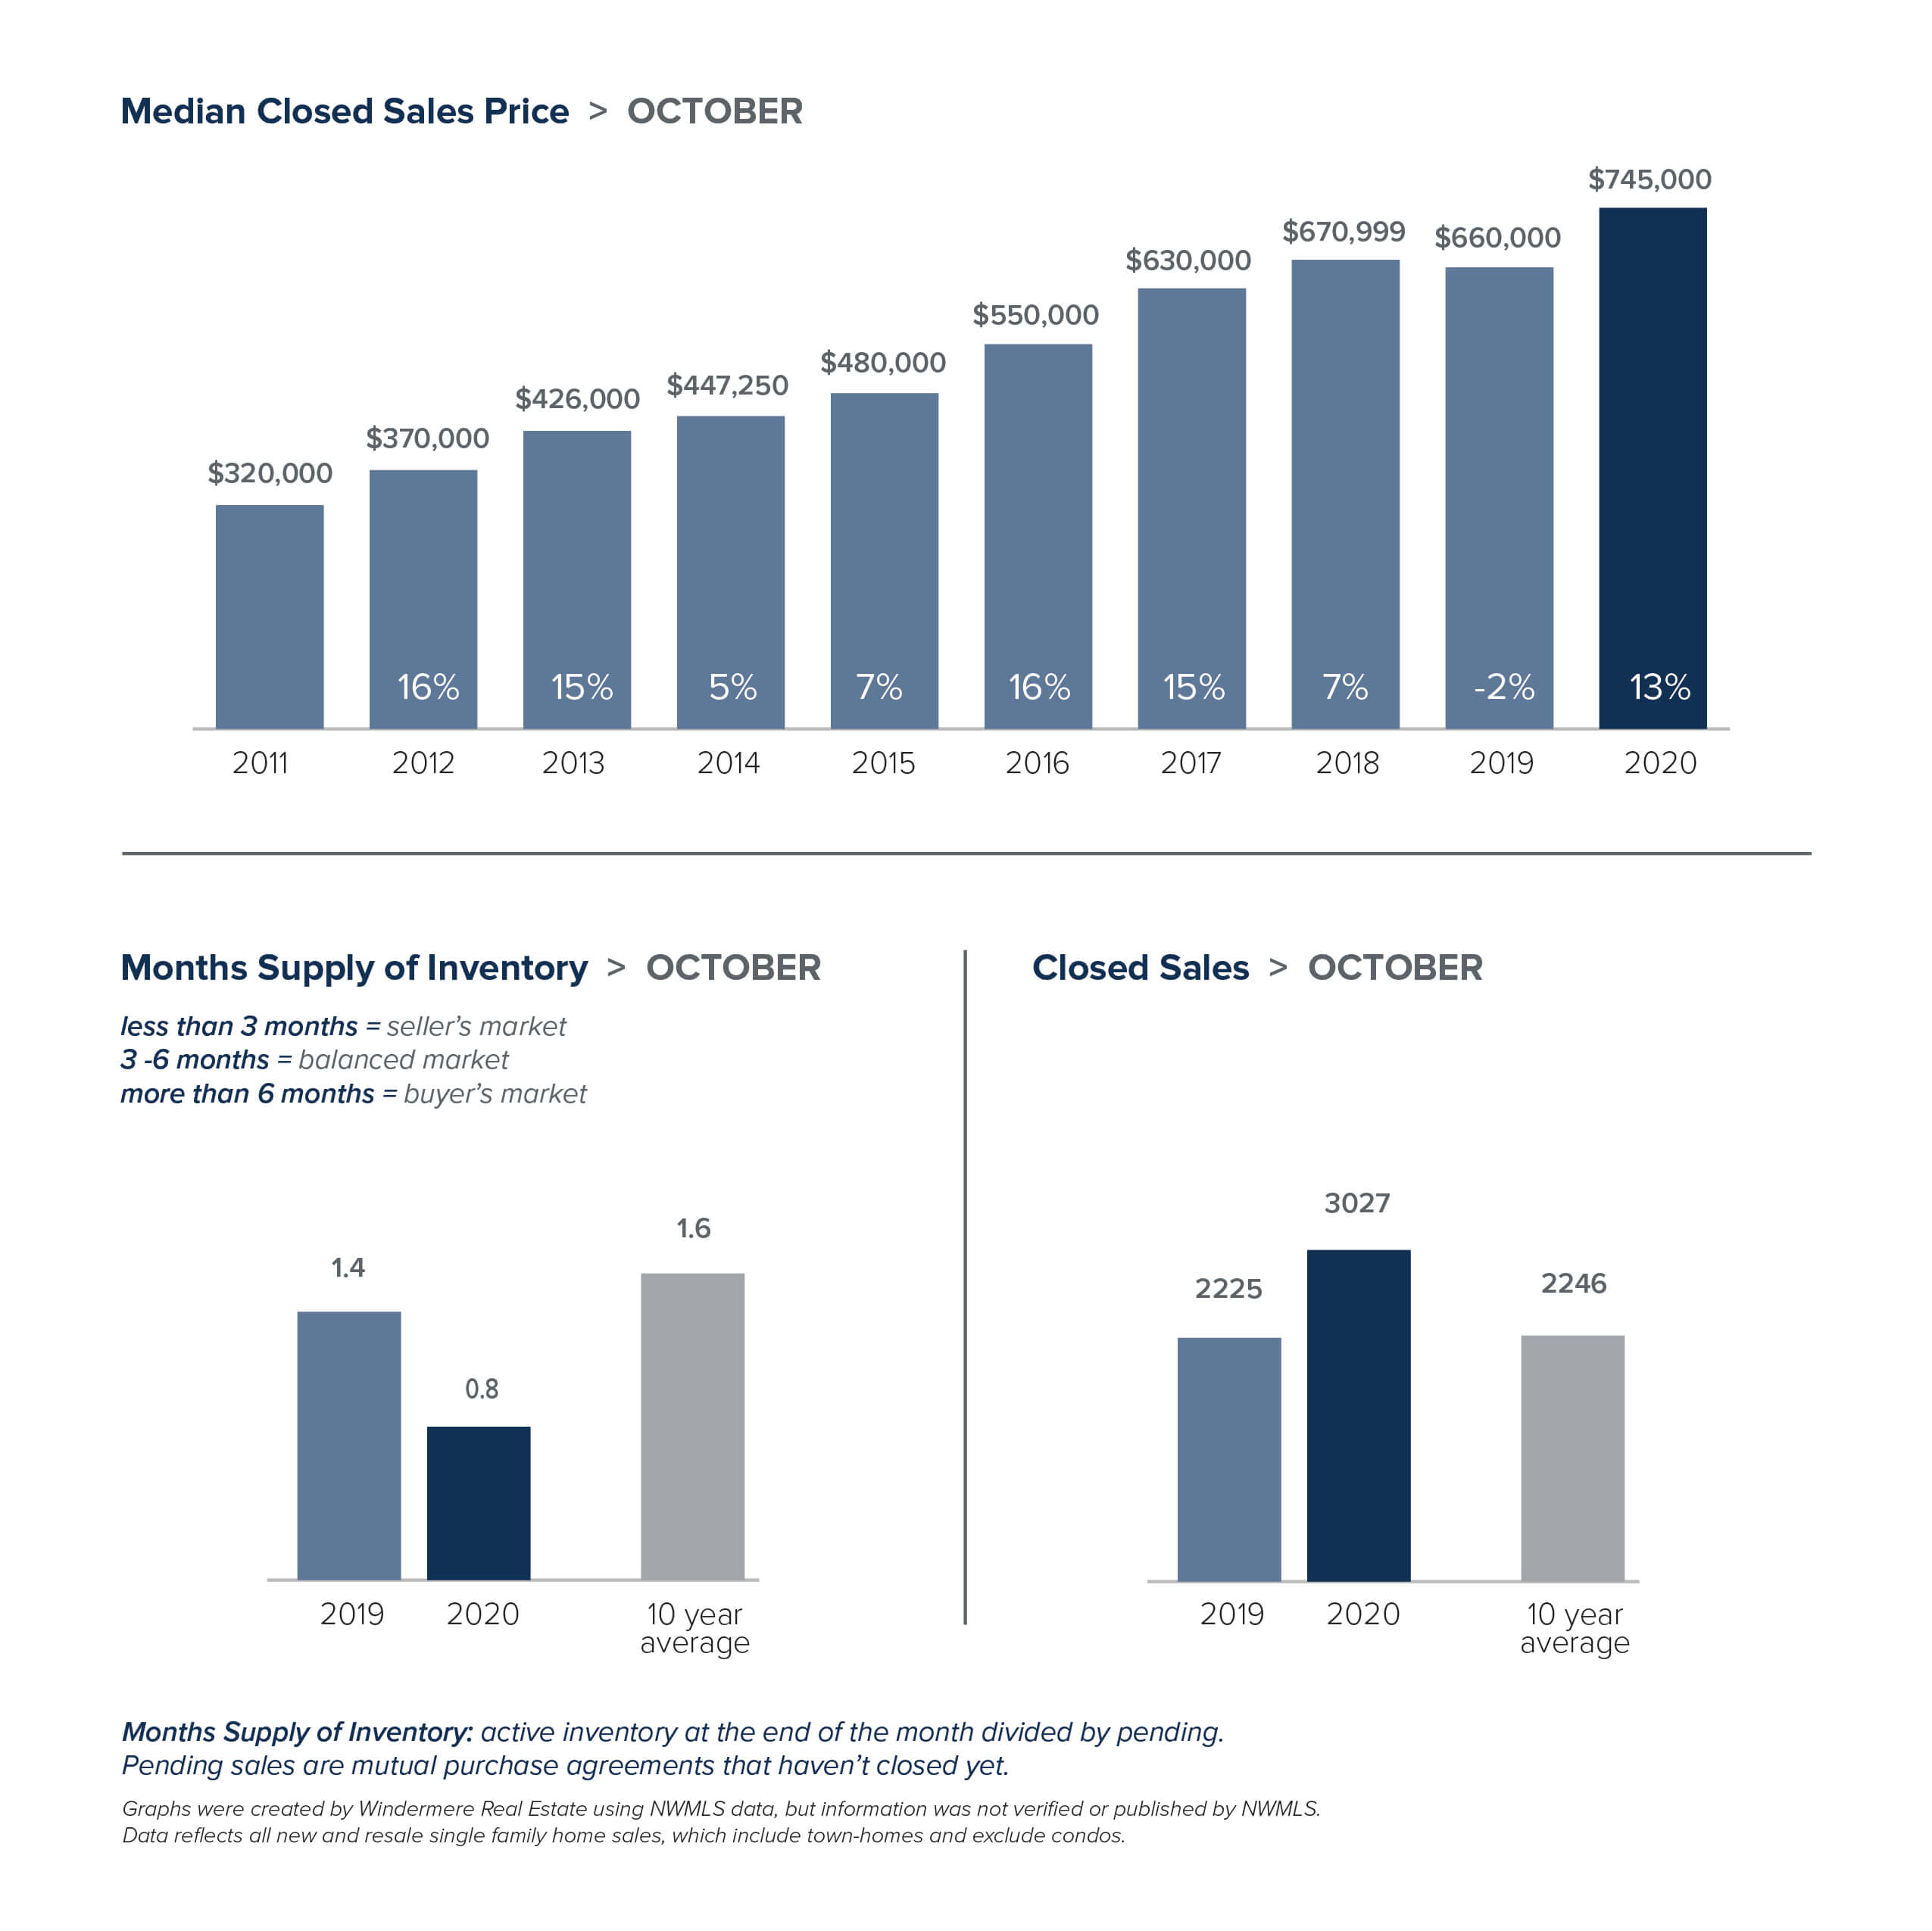
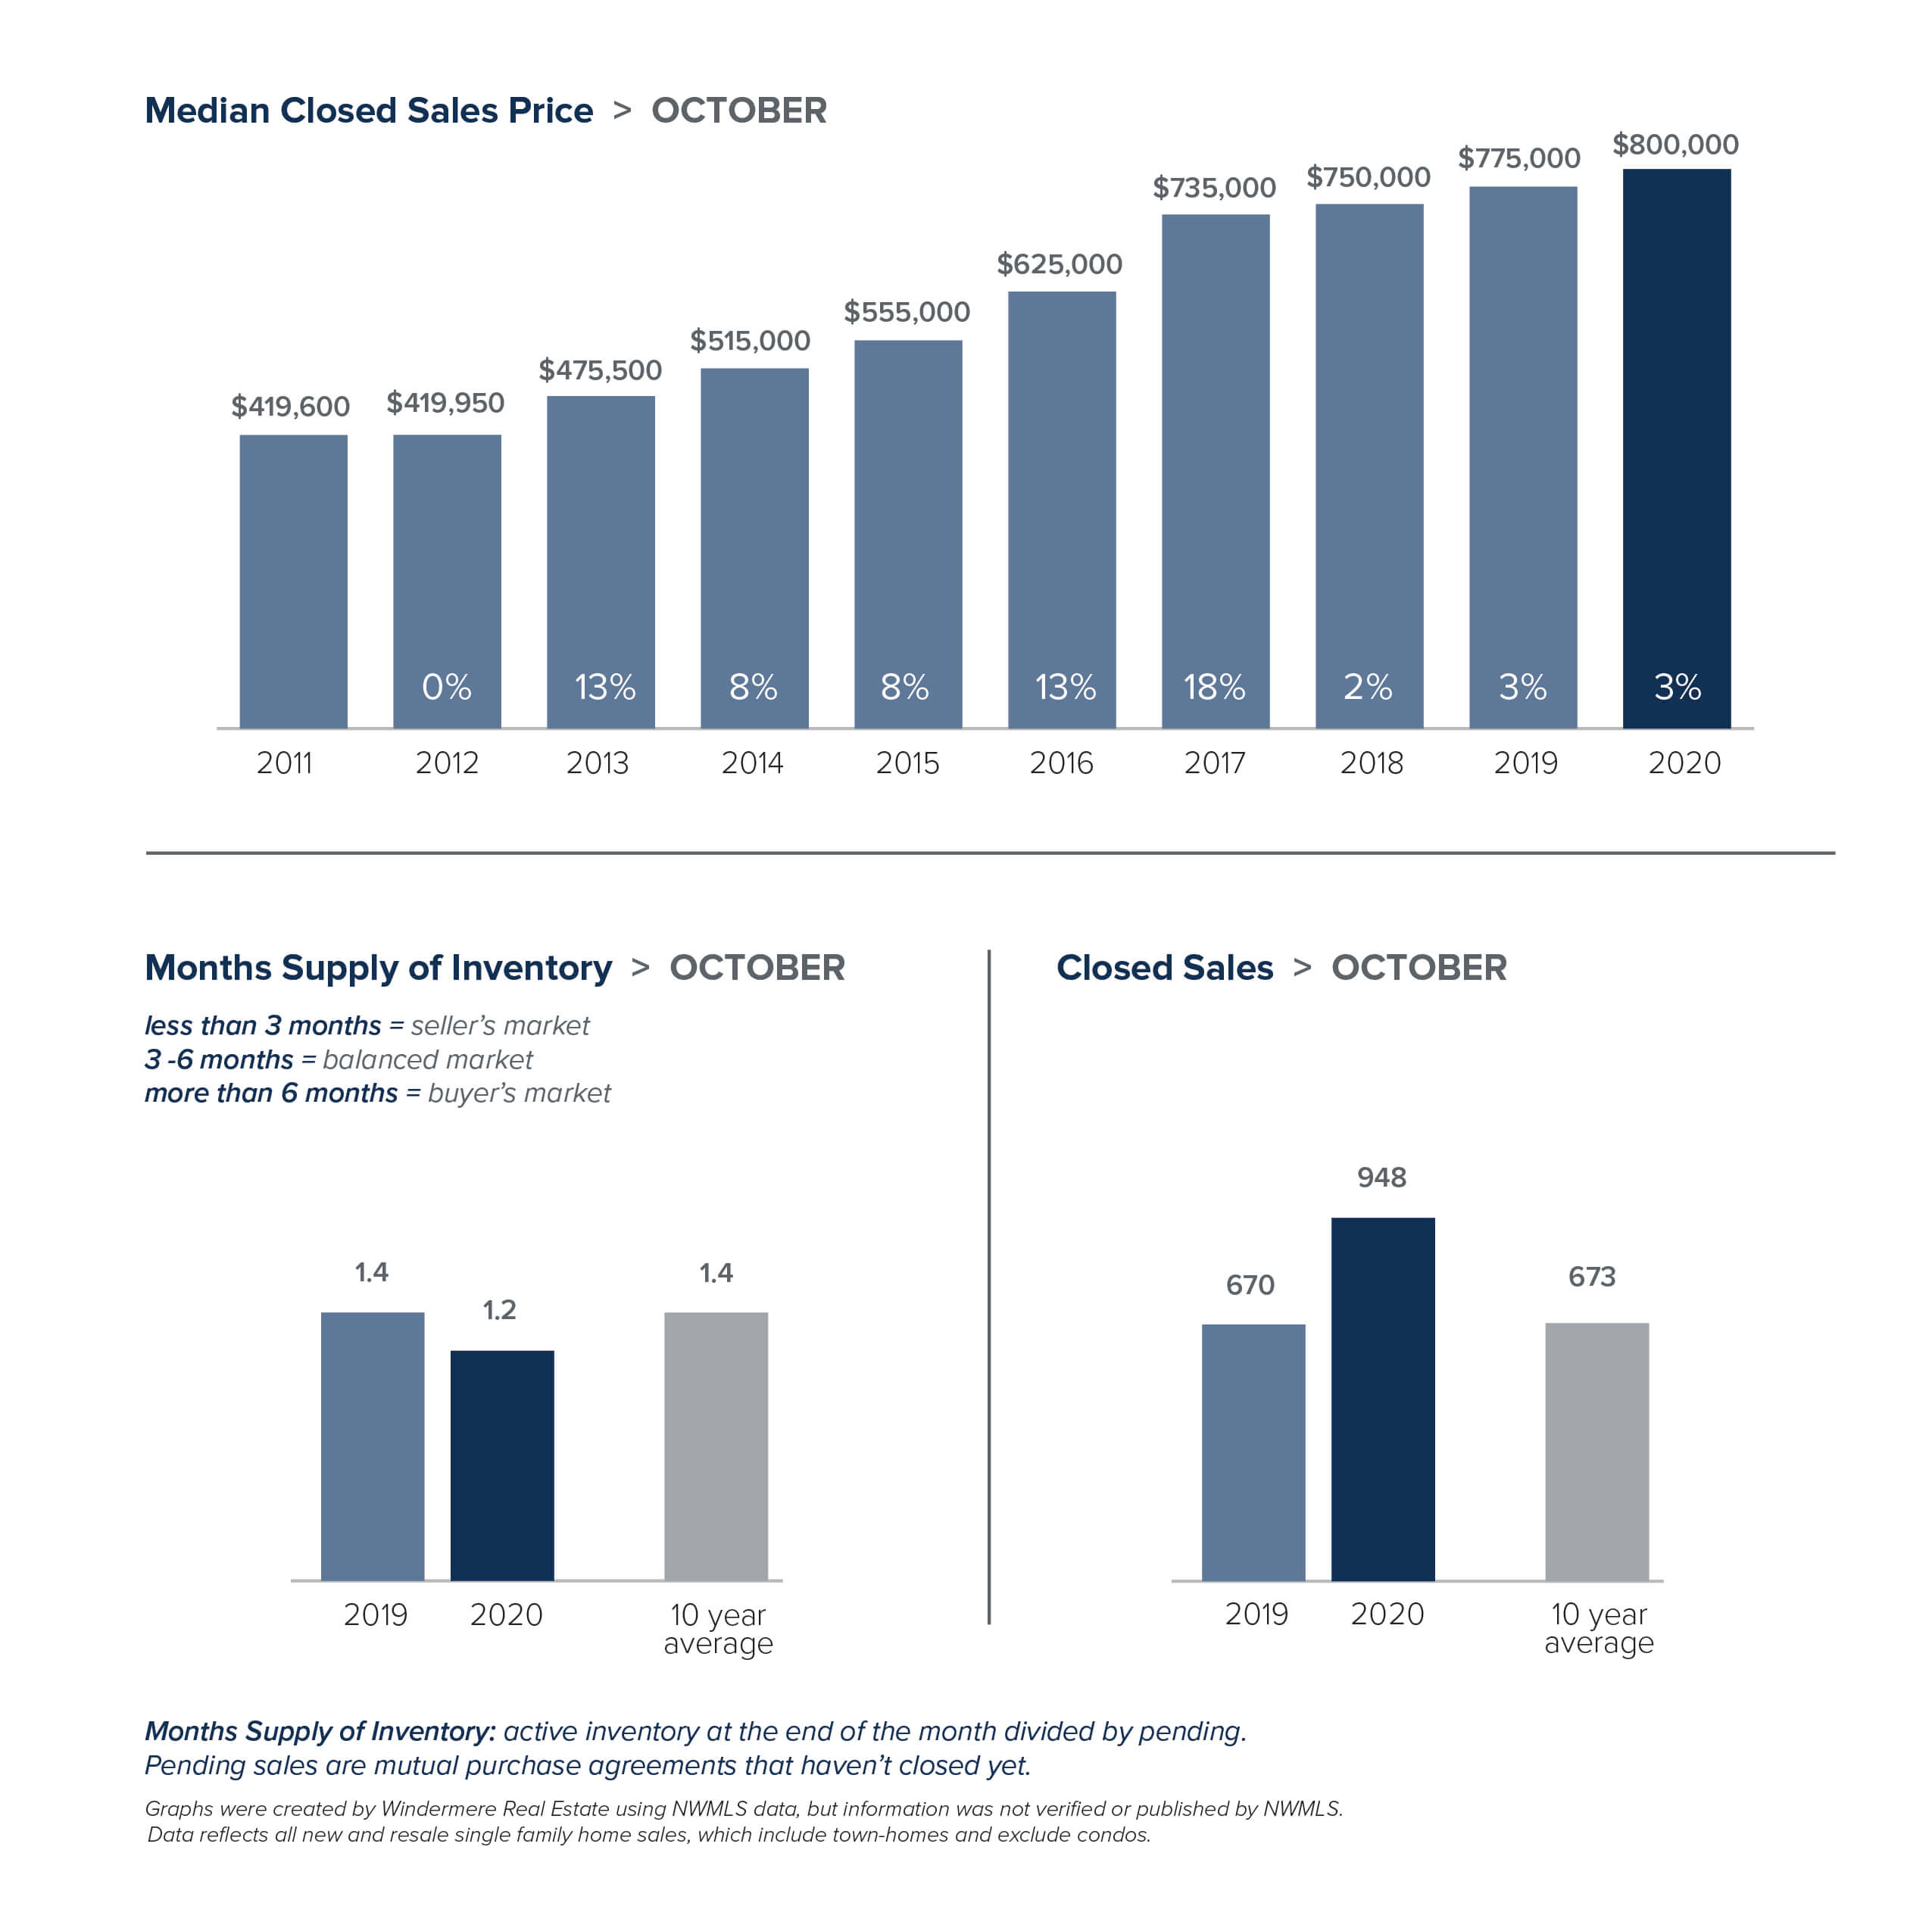
With supply unable to keep up with demand, home prices are escalating at double-digit rates. The median single-family home price in King County rose 14% over a year ago to $745,000. Prices in Snohomish County jumped 17% year-over-year to a record high of $579,972. About half the homes that closed in October sold for over the asking price as compared to about a quarter of the homes the same time last year.
The real estate market here is uncommonly resilient. Growing employment in major tech industries and an enviable quality of life have made our region one of the fastest growing areas in the country. With interest rates remaining at record lows, we may well skip the traditional slowing in the winter market altogether.
The charts below provide a brief overview of market activity. If you are interested in more information, every Monday Windermere Chief Economist Matthew Gardner provides an update regarding the impact of COVID-19 on the US economy and housing market. You can get Matthew’s latest update here.
EASTSIDE
KING COUNTY
SEATTLE
SNOHOMISH COUNTY

VIEW FULL SNOHOMISH COUNTY REPORT
This post originally appeared on GetTheWReport.com
Western Washington Real Estate Market Update


The following analysis of the Western Washington real estate market is provided by Windermere Real Estate Chief Economist Matthew Gardner. We hope that this information may assist you with making better-informed real estate decisions. For further information about the housing market in your area, please don’t hesitate to contact your Windermere agent.
REGIONAL ECONOMIC OVERVIEW
Employment numbers in Western Washington continue to improve following the massive decline caused by COVID-19. For perspective, the area shed more than 373,000 jobs between February and April. However, the recovery has been fairly robust: almost 210,000 of those jobs have returned. Unemployment levels remain elevated; the current rate is 8.2%. That said, it is down from 16.6% in April. The rate, of course, varies across Western Washington counties, with a current low of 7.2% in King County and a high of 11.2% in Grays Harbor County. The economy is healing, but the pace of improvement has slowed somewhat, which is to be expected. That said, I anticipate that jobs will continue to return as long as we do not see another spike in new infections.
HOME SALES
- Sales continued to improve following the COVID-19-related drop in the first quarter of the year. There were 25,477 transactions in the quarter, an increase of 11.6% from the same period in 2019, and 45.9% higher than in the second quarter of this year.
- Listing activity remains woefully inadequate, with total available inventory 41.7% lower than a year ago, but 1.6% higher than in the second quarter of this year.
- Sales rose in all but two counties, though the declines were minimal. The greatest increase in sales was in San Juan County, which leads one to wonder if buyers are actively looking in more isolated markets given ongoing COVID-19-related concerns.
- Pending sales—a good gauge of future closings—rose 29% compared to the second quarter of the year, suggesting that fourth quarter closings will be positive.

HOME PRICES
- Home-price growth in Western Washington rose a remarkable 17.1% compared to a year ago. The average sale price was $611,793.
- When compared to the same period a year ago, price growth was strongest in Mason, Island, and San Juan counties. Only one county saw prices rise by less than ten percent.
- It was even more impressive to see the region’s home prices up by a very significant 9.4% compared to the second quarter of 2020. It is clear that low mortgage rates, combined with limited inventory, are pushing prices up.
- As long as mortgage rates stay low, and there isn’t an excessive spike in supply (which is highly unlikely), prices will continue to rise at above-average rates. That said, if this continues for too long, we will start to face affordability issues in many markets.

DAYS ON MARKET
- The average number of days it took to sell a home in the third quarter of this year dropped two days compared to a year ago.
- Snohomish County was the tightest market in Western Washington, with homes taking an average of only 16 days to sell. All but two counties—Lewis and San Juan—saw the length of time it took to sell a home rise compared to the same period a year ago.
- Across the region, it took an average of 36 days to sell a home in the quarter. It is also worth noting that it took an average of 4 fewer days to sell a home than in the second quarter of this year.
- The takeaway here is that significant increases in demand, in concert with remarkably low levels of inventory, continue to drive market time lower.

CONCLUSIONS

This speedometer reflects the state of the region’s real estate market using housing inventory, price gains, home sales, interest rates, and larger economic factors.
High demand, favorable interest rates, and low supply clearly point to a seller’s market in Western Washington. As such, I am moving the needle even more in favor of sellers.
As I suggested earlier in this report, although the market is remarkably buoyant, I am starting to see affordability issues increase in many areas—not just in the central Puget Sound region—and this is concerning. Perhaps the winter will act to cool the market, but something is telling me we shouldn’t count on it.
ABOUT MATTHEW GARDNER
 As Chief Economist for Windermere Real Estate, Matthew Gardner is responsible for analyzing and interpreting economic data and its impact on the real estate market on both a local and national level. Matthew has over 30 years of professional experience both in the U.S. and U.K.
In addition to his day-to-day responsibilities, Matthew sits on the Washington State Governors Council of Economic Advisors; chairs the Board of Trustees at the Washington Center for Real Estate Research at the University of Washington; and is an Advisory Board Member at the Runstad Center for Real Estate Studies at the University of Washington where he also lectures in real estate economics.
This post originally appeared on the Windermere.com Blog
Local Market Update – October 2020

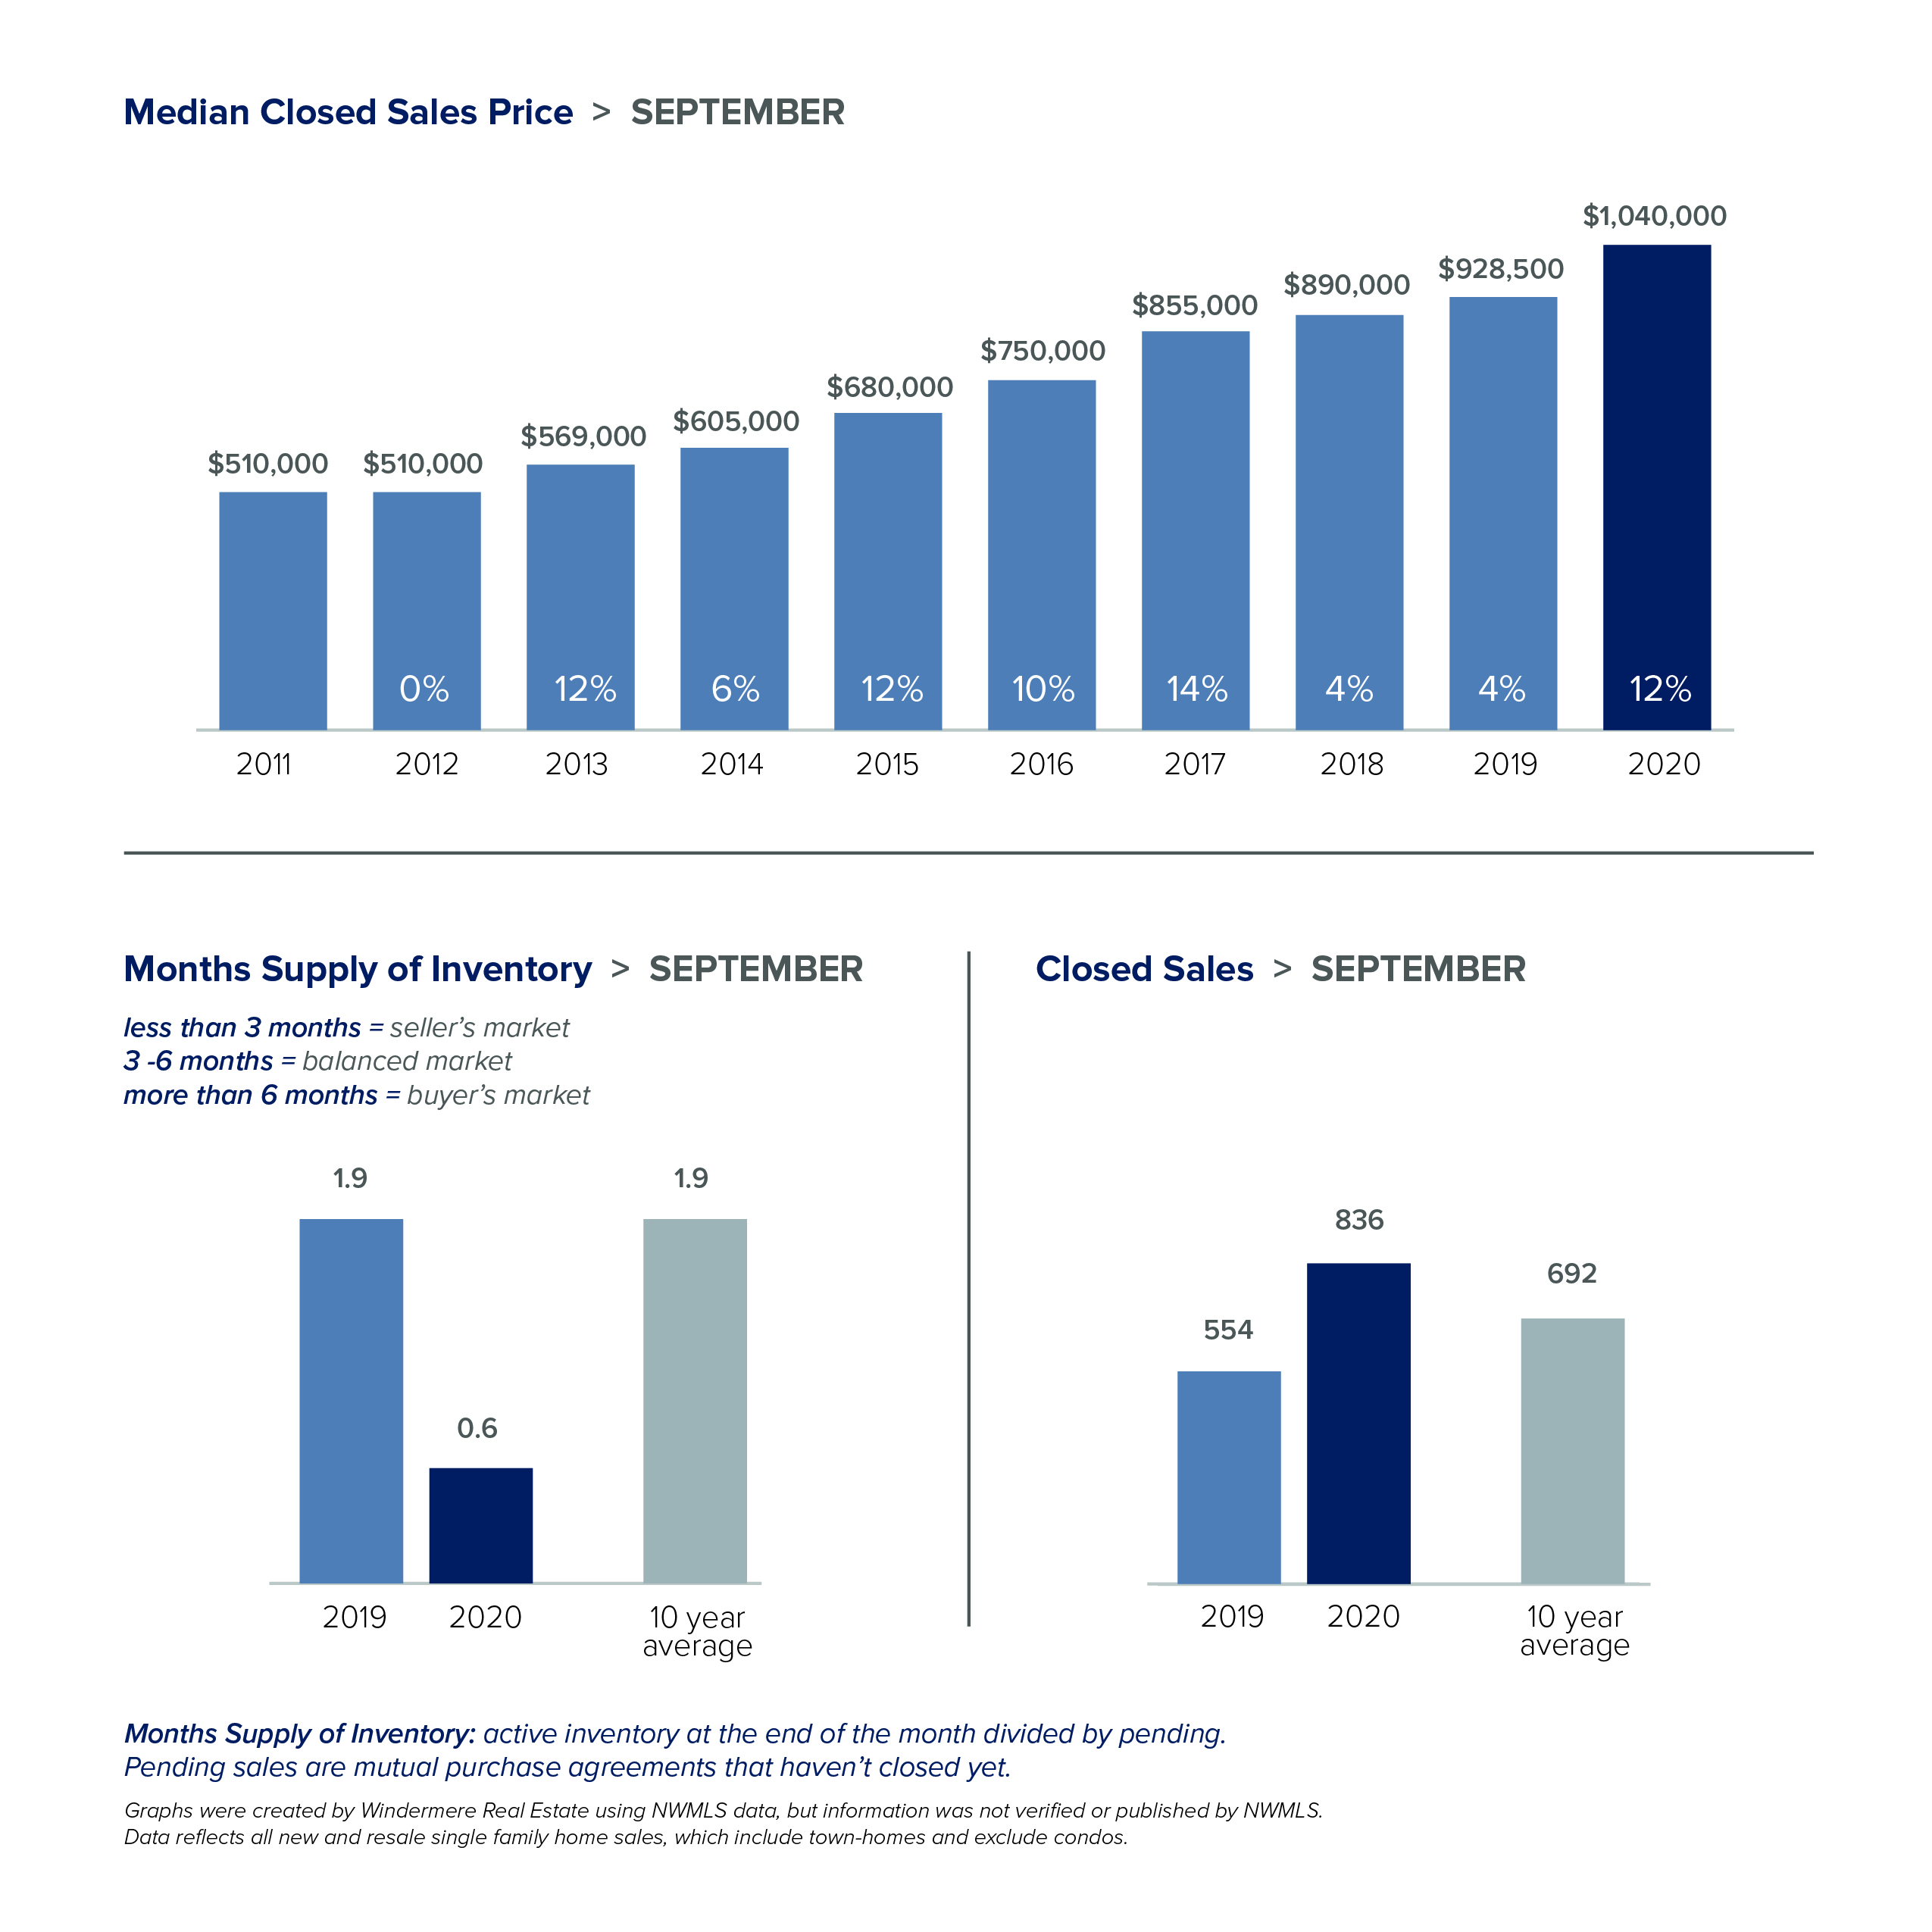
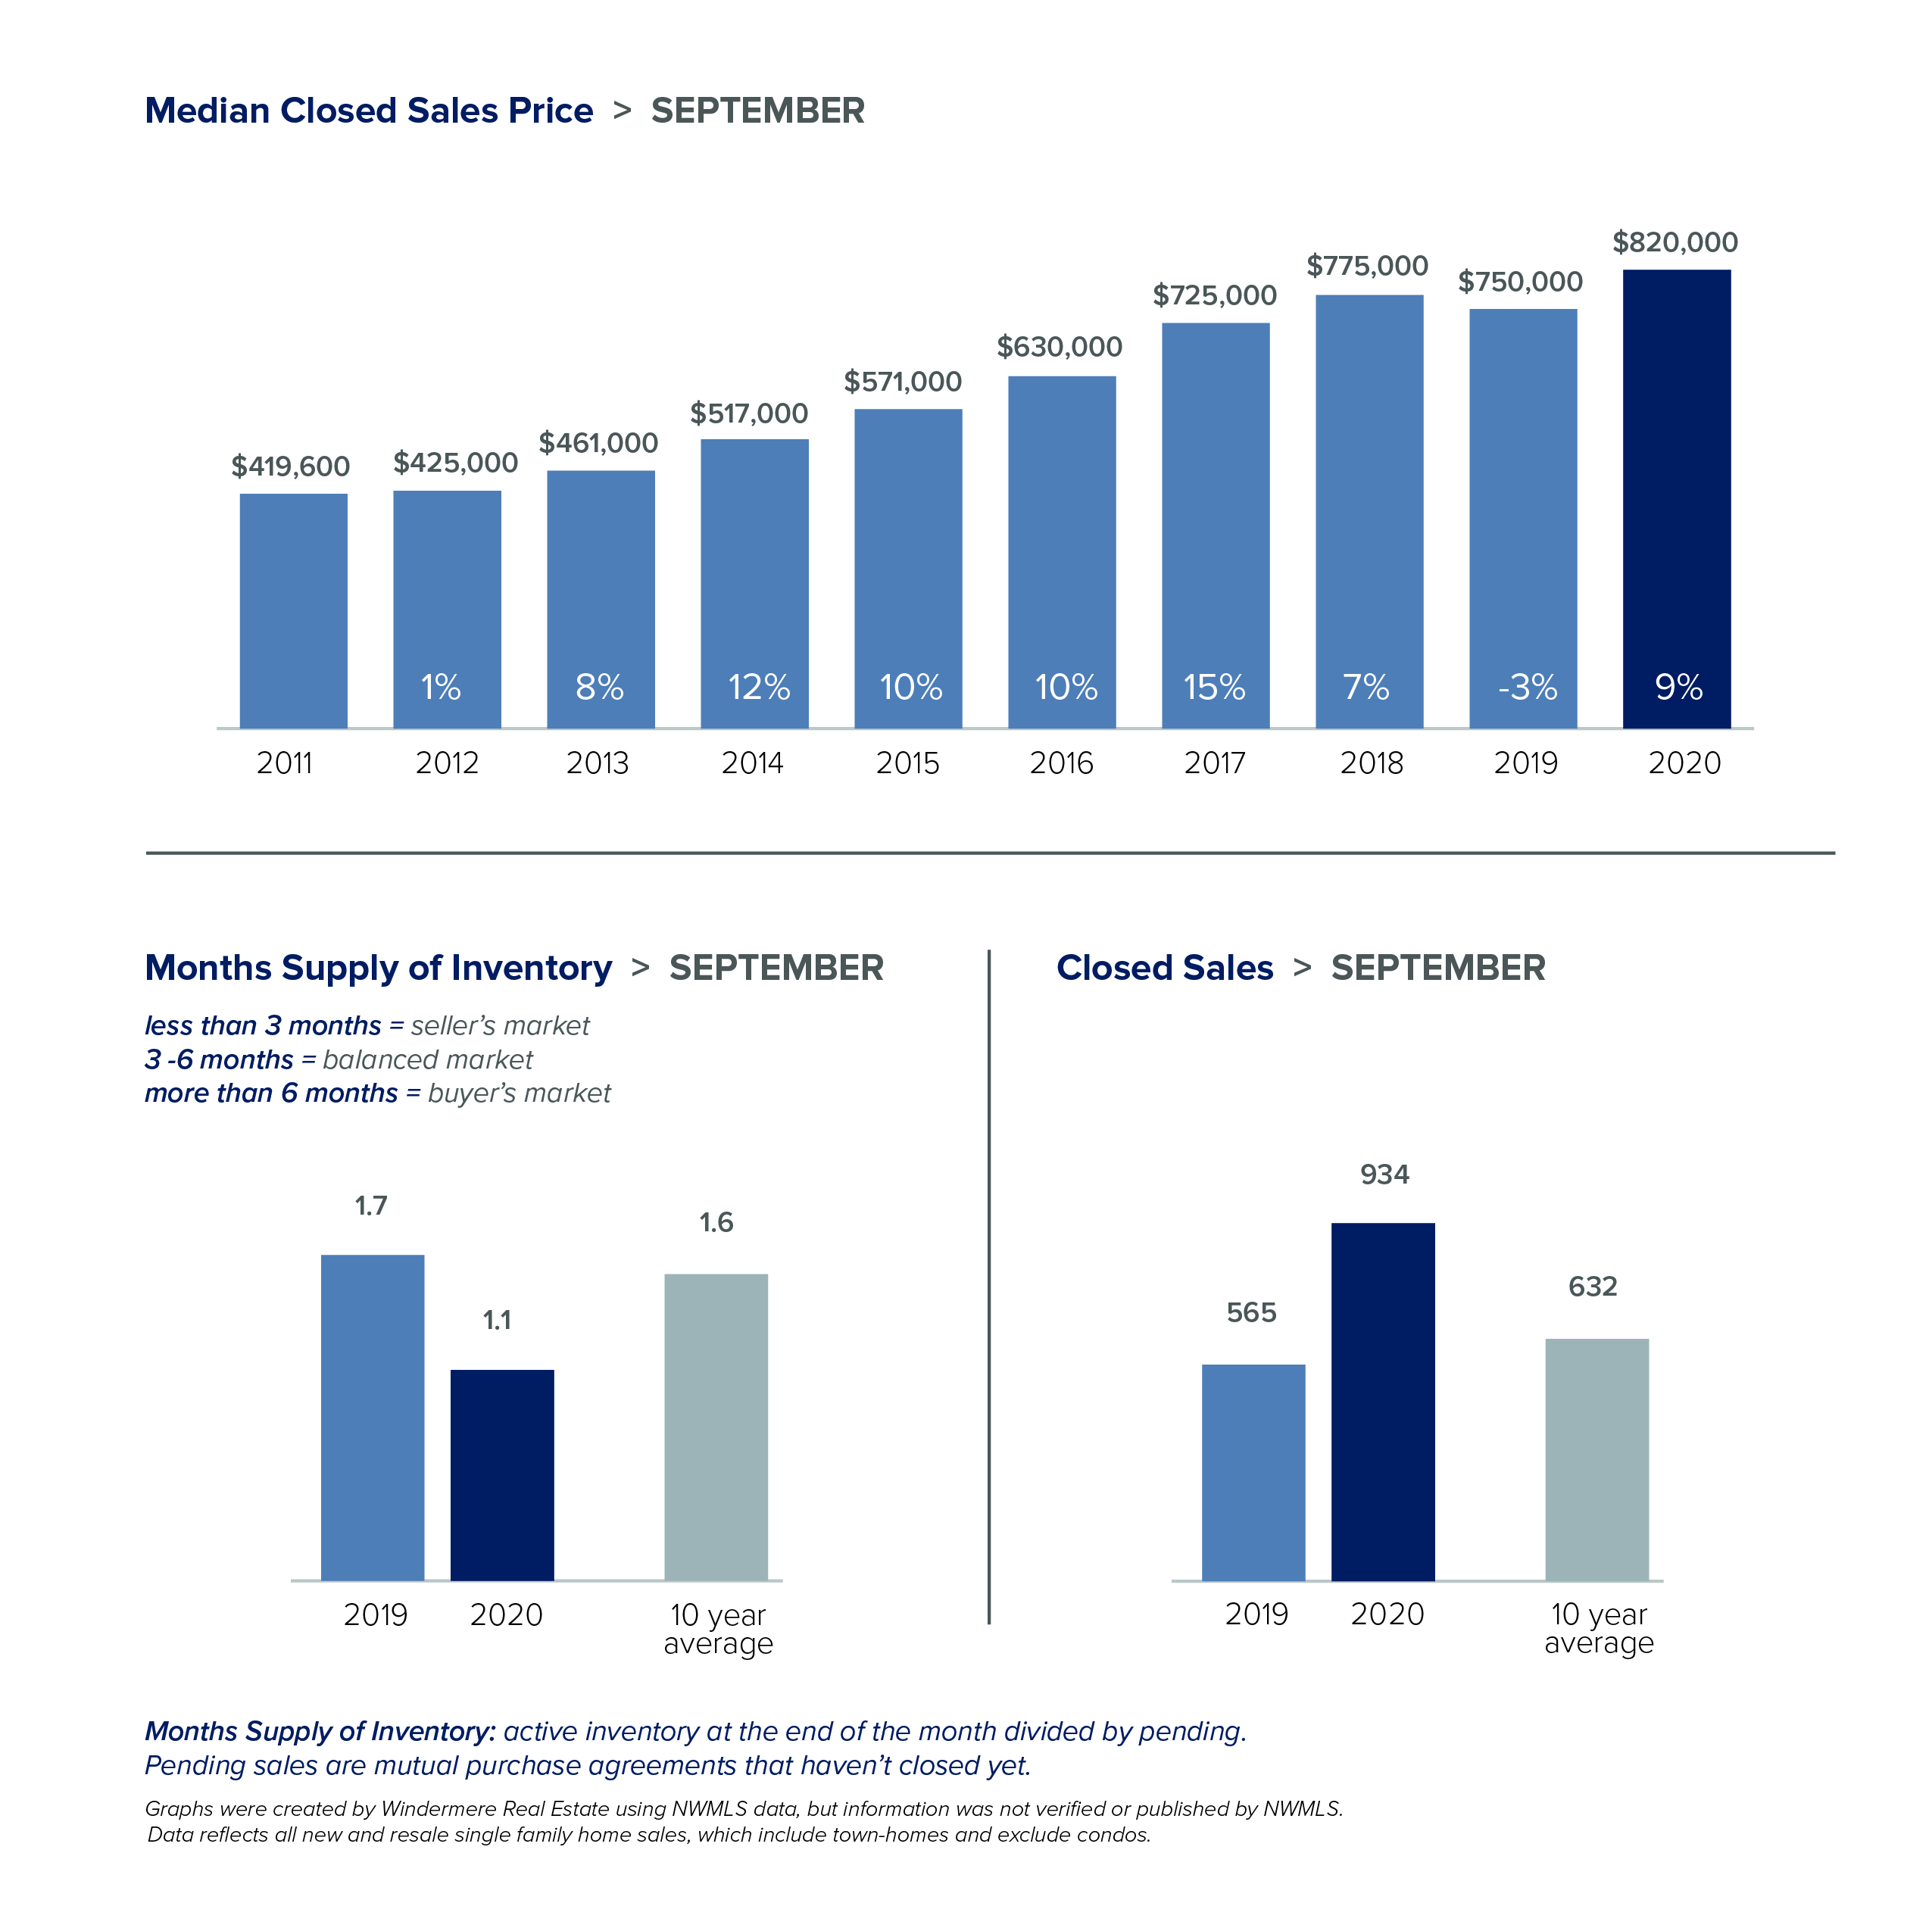
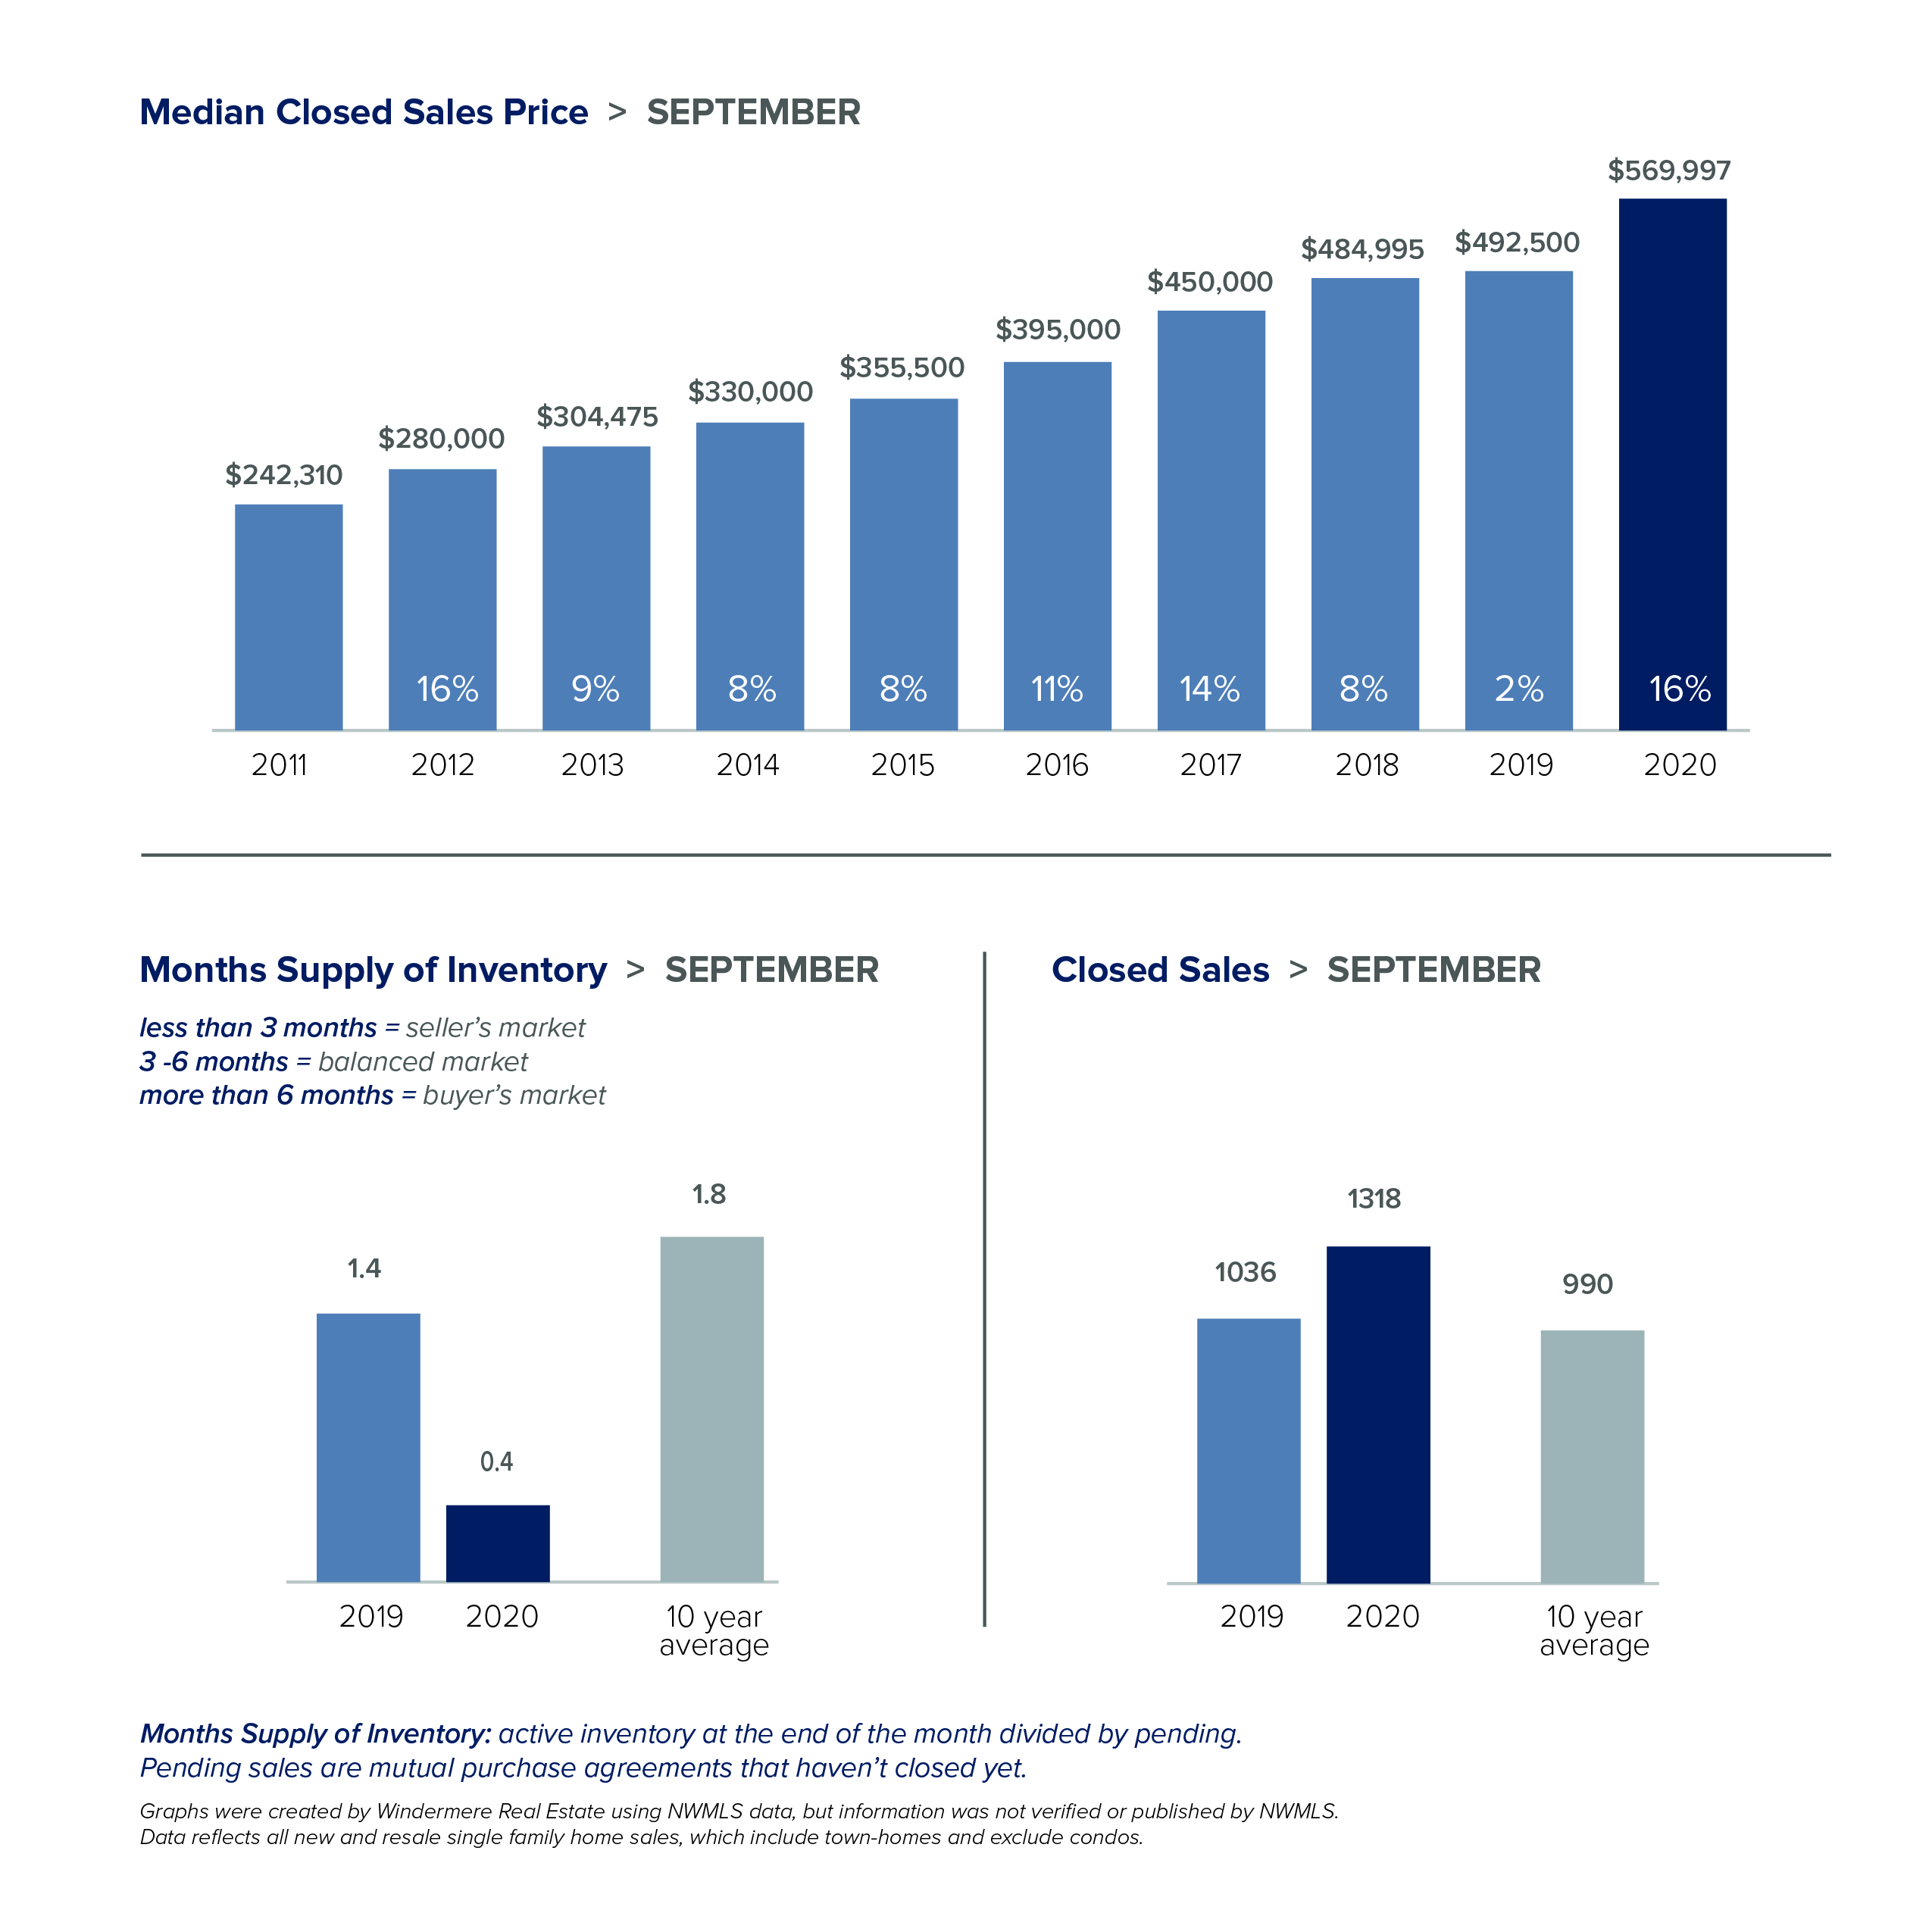
While daily life may seem unpredictable, the local real estate market remains extremely stable. Activity in September acted more like the traditional peak spring market with home sales soaring and prices hitting record highs. Inventory remains very tight and new listings are selling quickly in every price range.
There just aren’t enough homes on the market to meet demand. King County had about half the inventory of a year ago. Snohomish County had 63% fewer available homes. On the other hand, the number of condos on the market in King County jumped by 24% over last September. Brokers attribute the flood of new inventory to COVID remote workers looking to trade their in-city condo for more living space. Despite the increase in inventory, condo prices rose 8% in September and pending sales — the best indicator of current demand — shot up 36% over the same period last year.
The slim supply of single-family homes means bidding wars and all-cash offers were the norm, driving prices to record highs. King County saw the third consecutive month of record-setting values. The median home price hit $753,600 in September, a 14% jump over last year. Prices in Snohomish County soared 16% from a year ago to $569,997, just shy of its all-time high of $575,000. For both counties, half the homes sold for over list price in September as compared with just a quarter of the homes a year ago.
The market doesn’t show signs of cooling off any time soon. In September the greater Northwest area saw the highest number of transactions since June 2018. Pending sales were up 32% in King County and 29% in Snohomish County. Interest rates continue to be at historic lows. With the area posting some of the fastest population growth in the country, expect the market to stay unseasonably hot.
The charts below provide a brief overview of market activity. If you are interested in more information, every Monday Windermere Chief Economist Matthew Gardner provides an update regarding the impact of COVID-19 on the US economy and housing market. You can get Matthew’s latest update here.
EASTSIDE
KING COUNTY

SEATTLE
SNOHOMISH COUNTY
VIEW FULL SNOHOMISH COUNTY REPORT
This post originally appeared on GettheWReport.com
Local Market Update – September 2020

August saw the lowest number of homes for sale in more than 20 years and the lowest mortgage rates on record. Sparse inventory and high demand pushed home prices to new highs.
- With pending sales outpacing new listings, inventory continues to shrink. King and Snohomish counties each have about a two-week supply of available homes. Four to six months of inventory is considered a balanced market, favoring neither buyers nor sellers.
- The region saw the second consecutive month of record-setting price growth with home prices experiencing double-digit increases as compared to a year ago.
- Fierce competition among buyers has made multiple offers the norm. In King County, 46% of home sold for more than the list price. Last August that number was 24%. In Snohomish County, 58% of homes sold above list price as compared to just 28% the prior year.
The charts below provide a brief overview of market activity. If you are interested in more information, every Monday Windermere Chief Economist Matthew Gardner provides an update regarding the impact of COVID-19 on the US economy and housing market. You can get Matthew’s latest update here.
EASTSIDE
KING COUNTY
SEATTLE
SNOHOMISH COUNTY
VIEW FULL SNOHOMISH COUNTY REPORT
This post originally appeared on
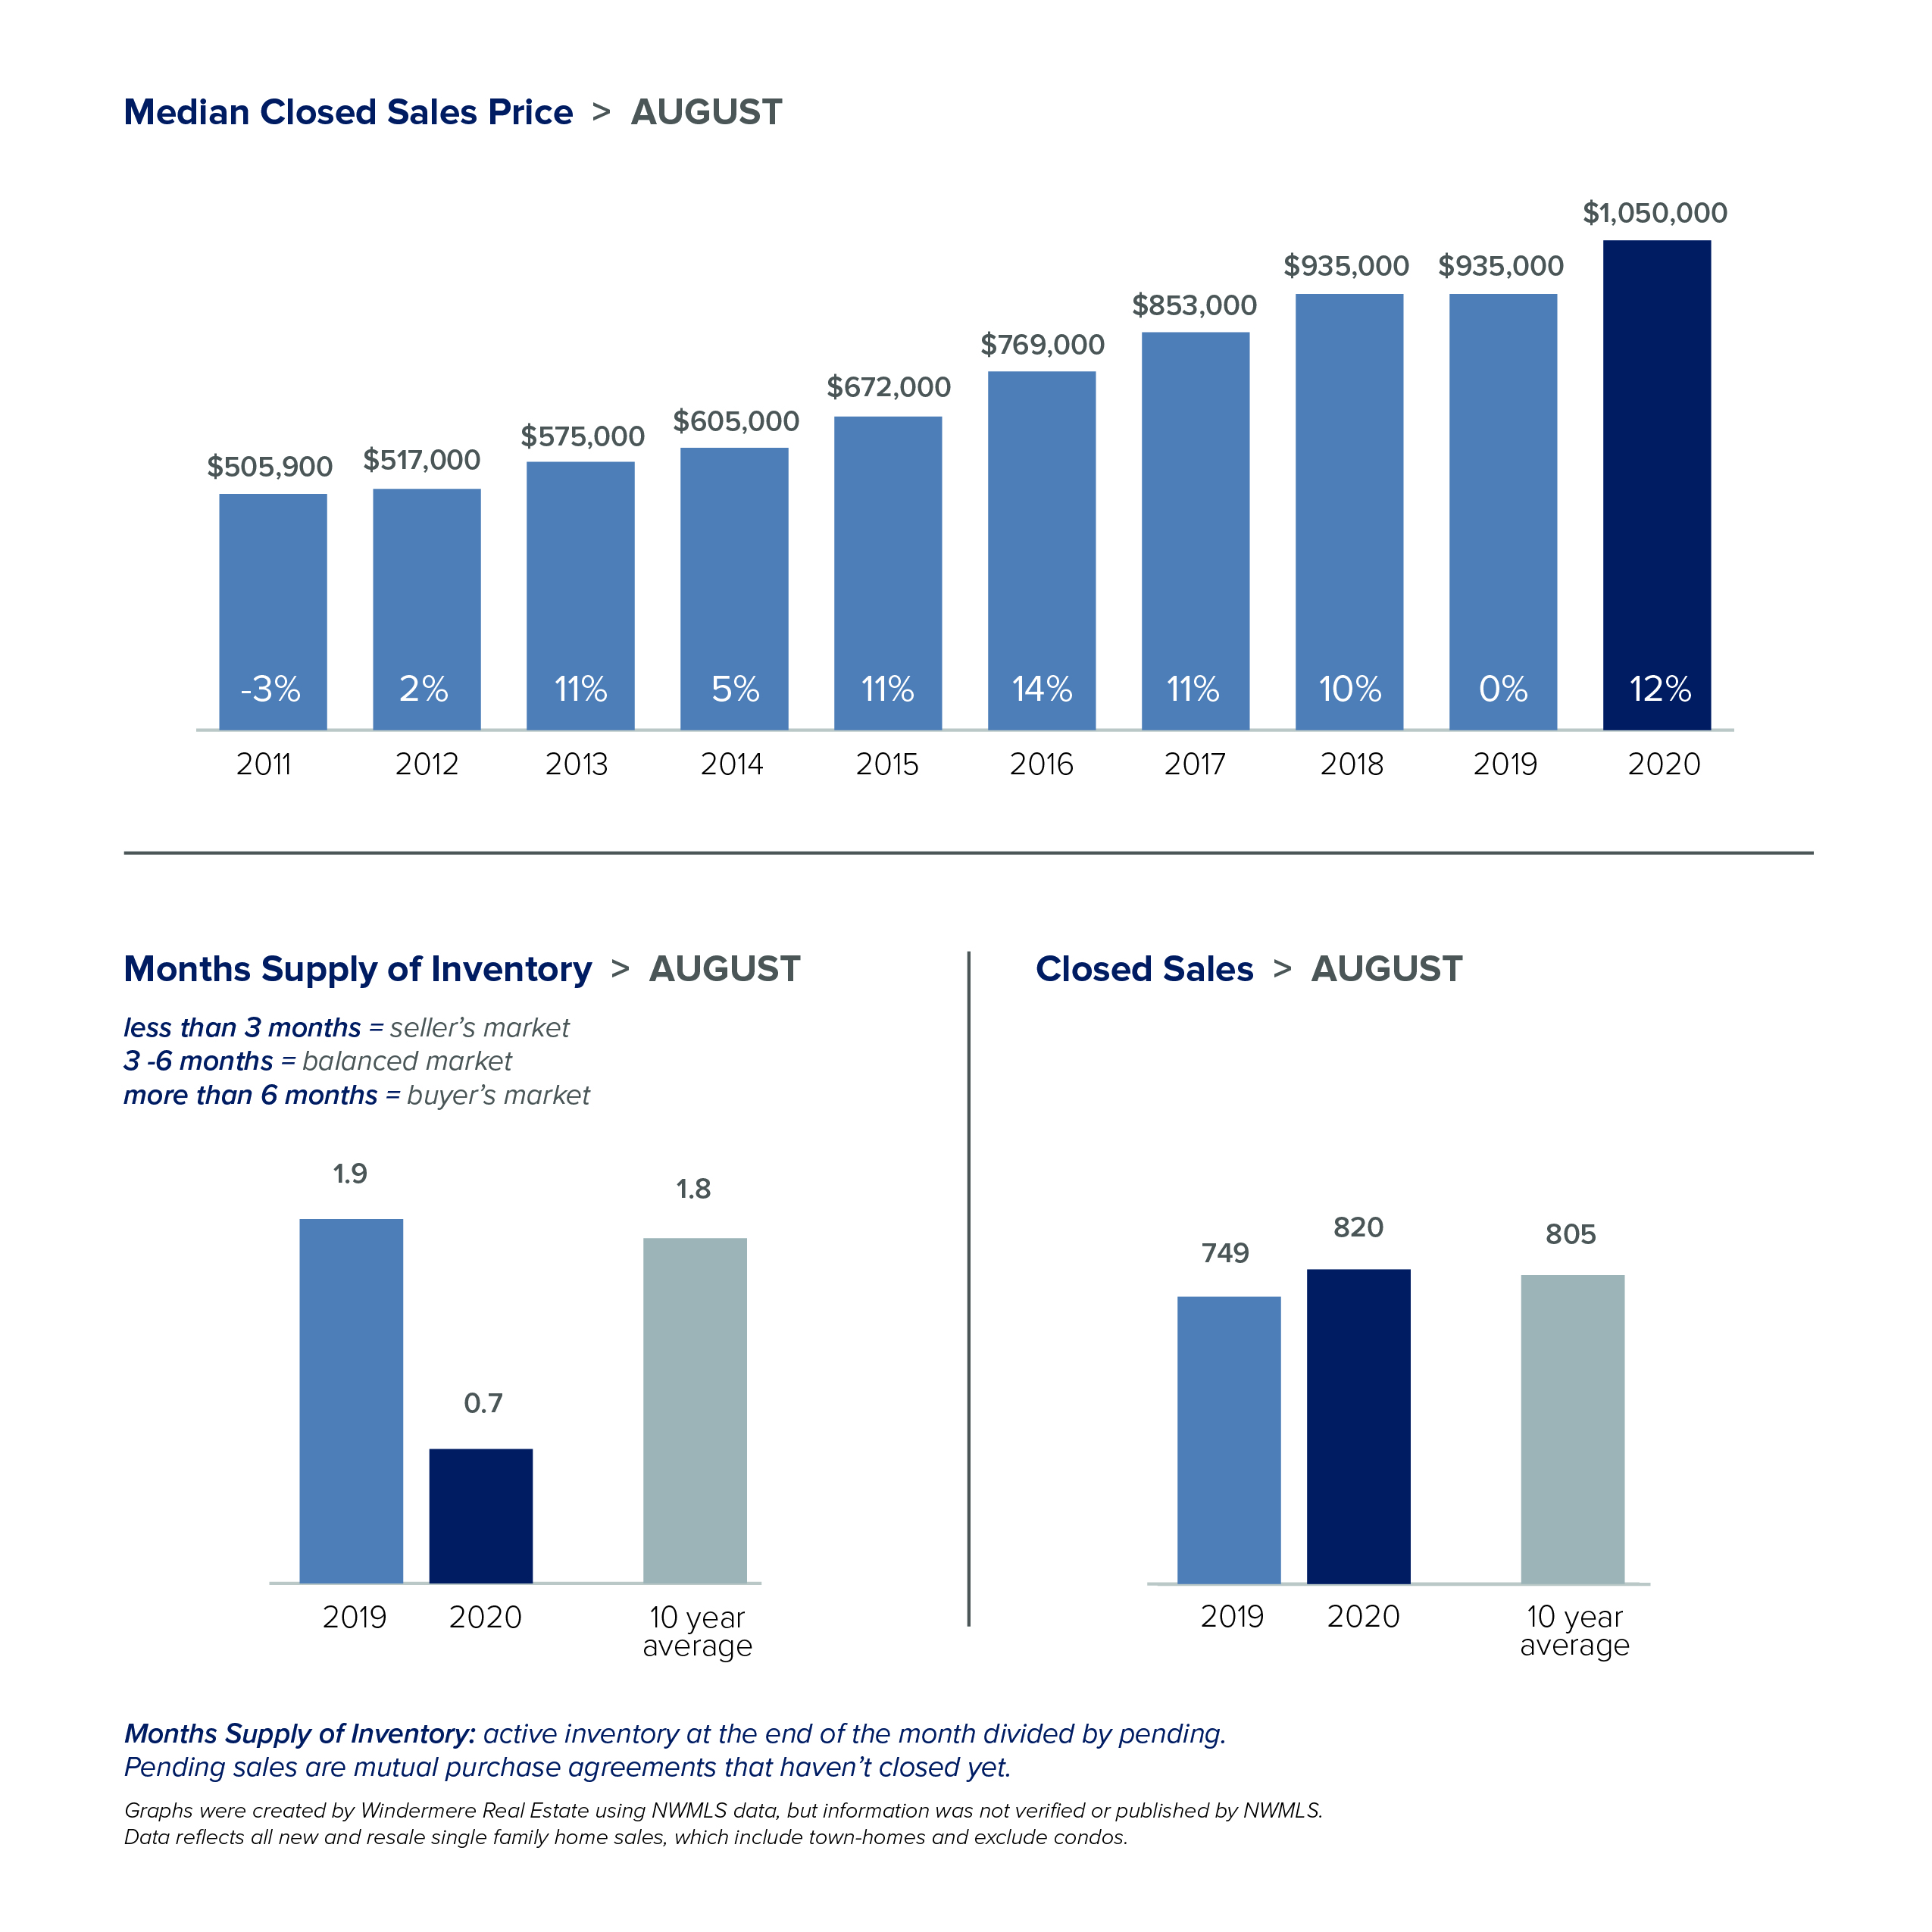
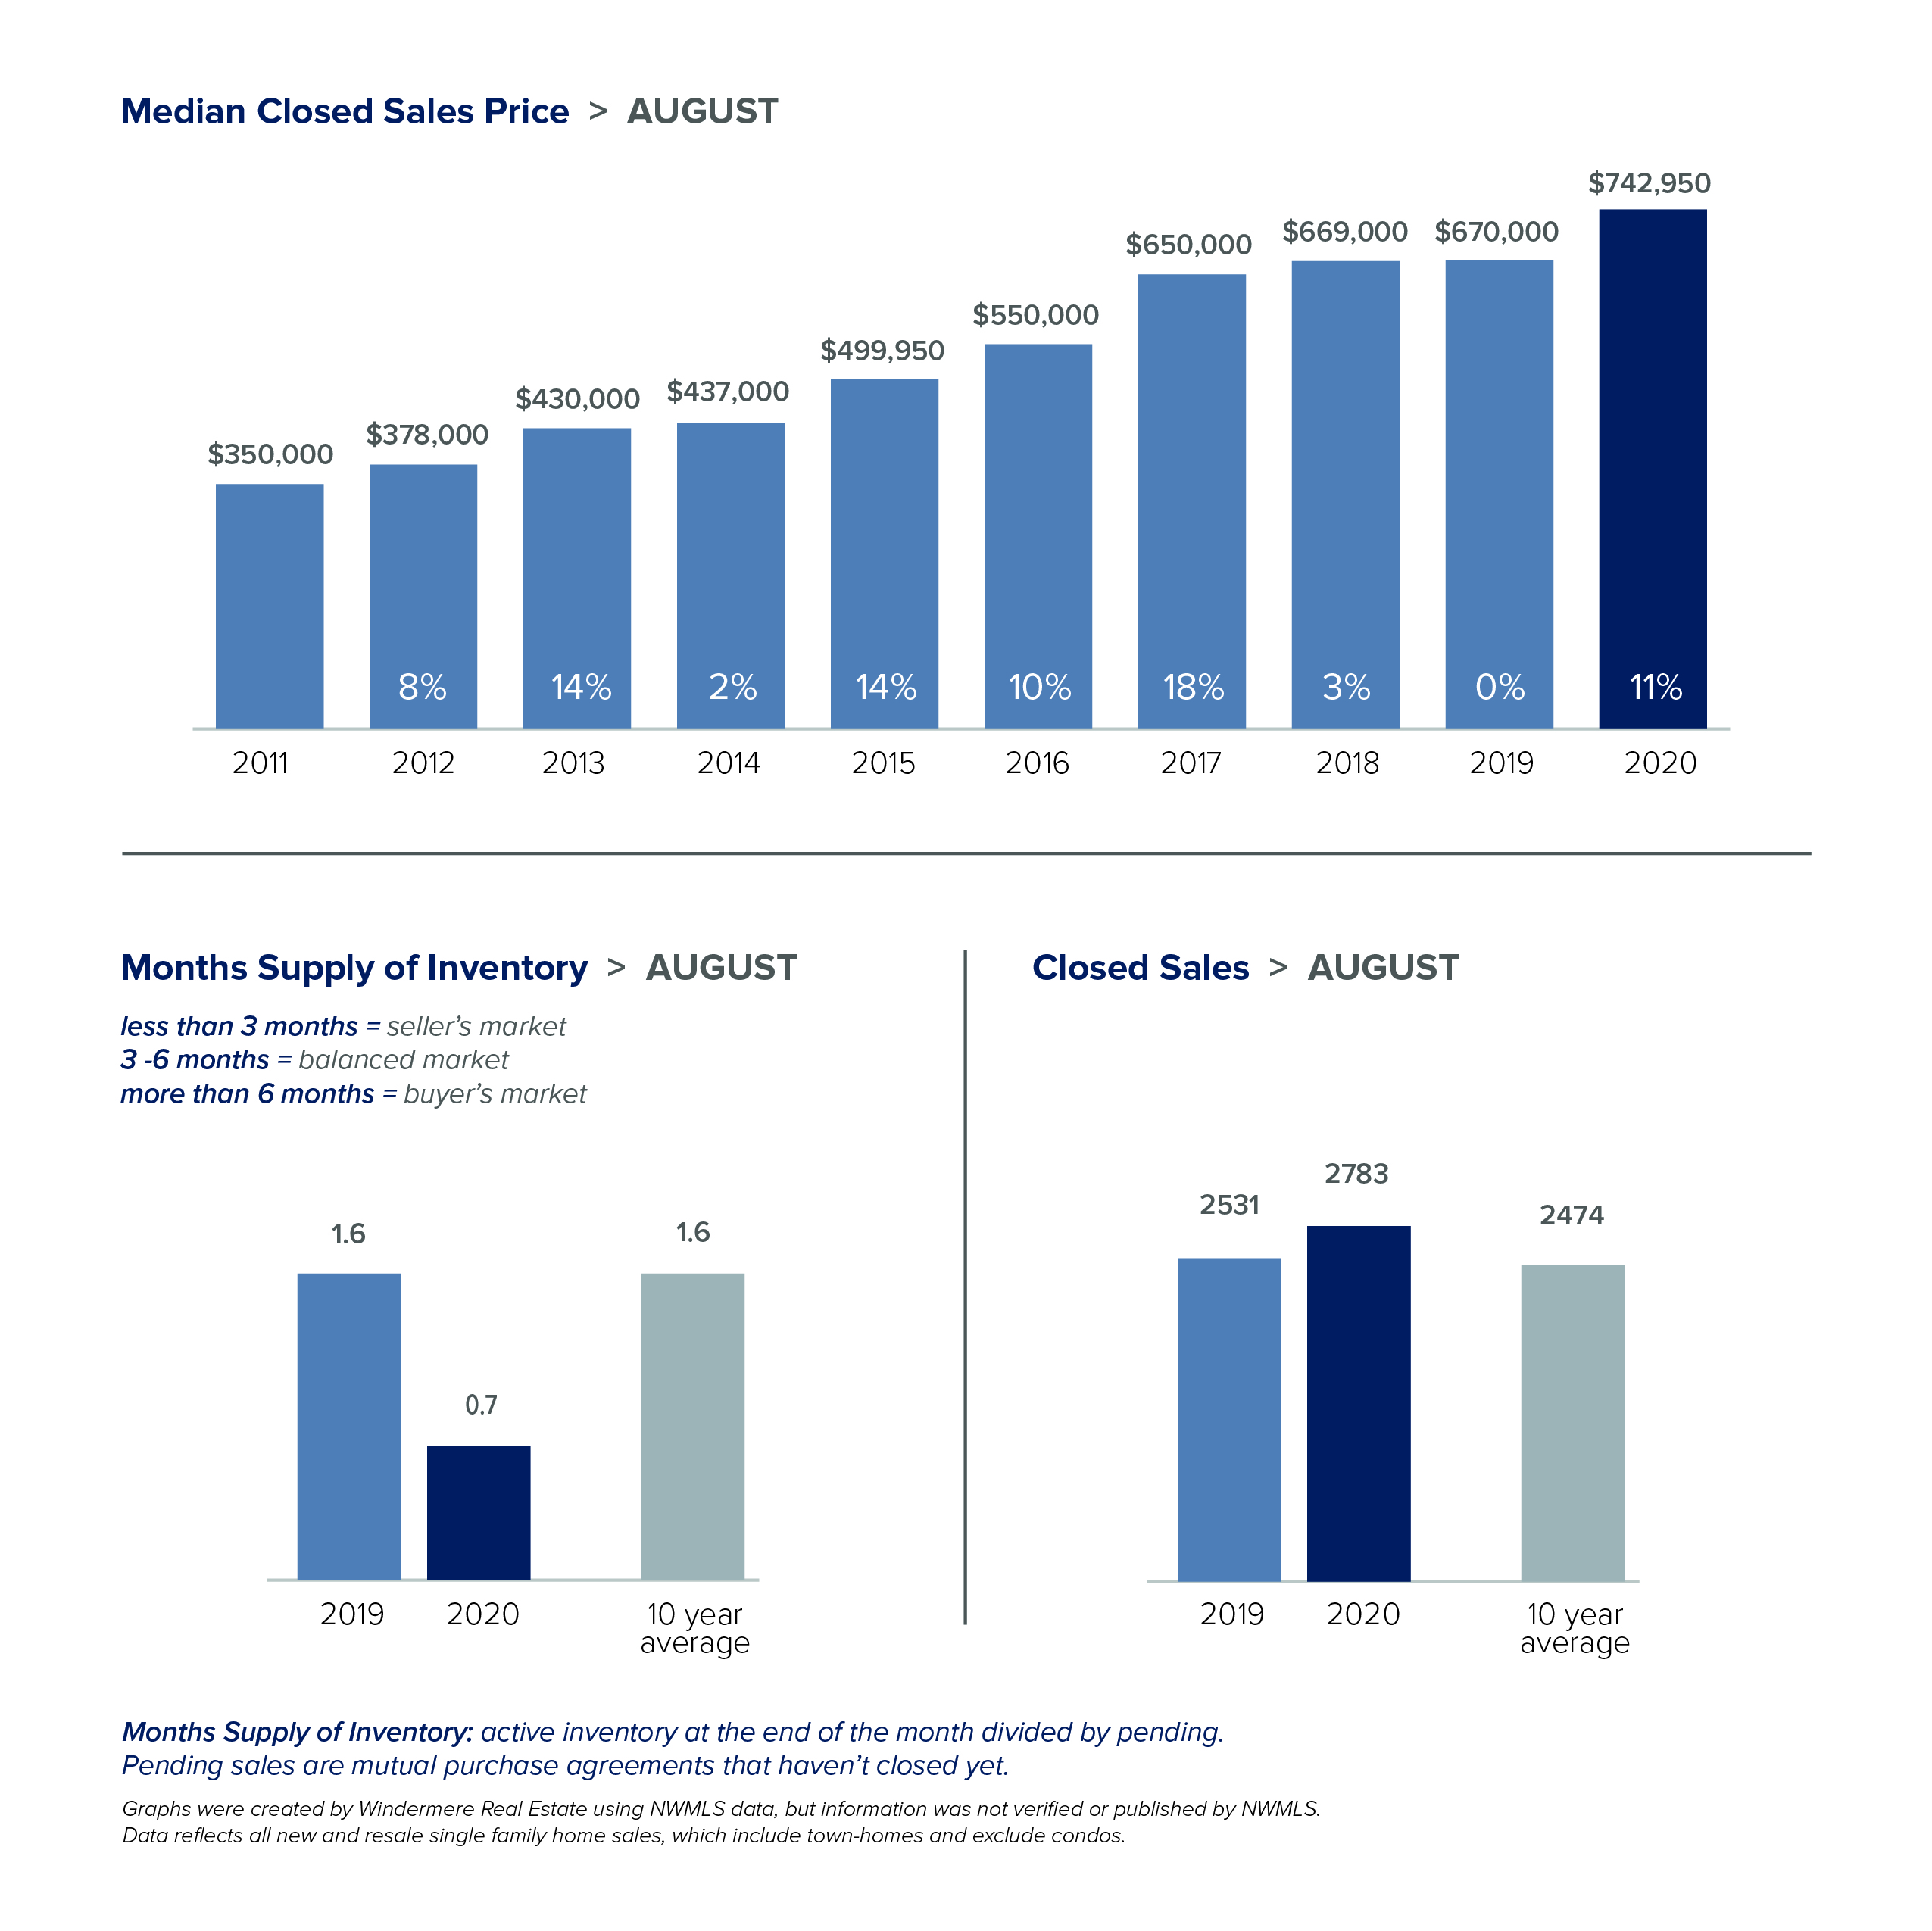
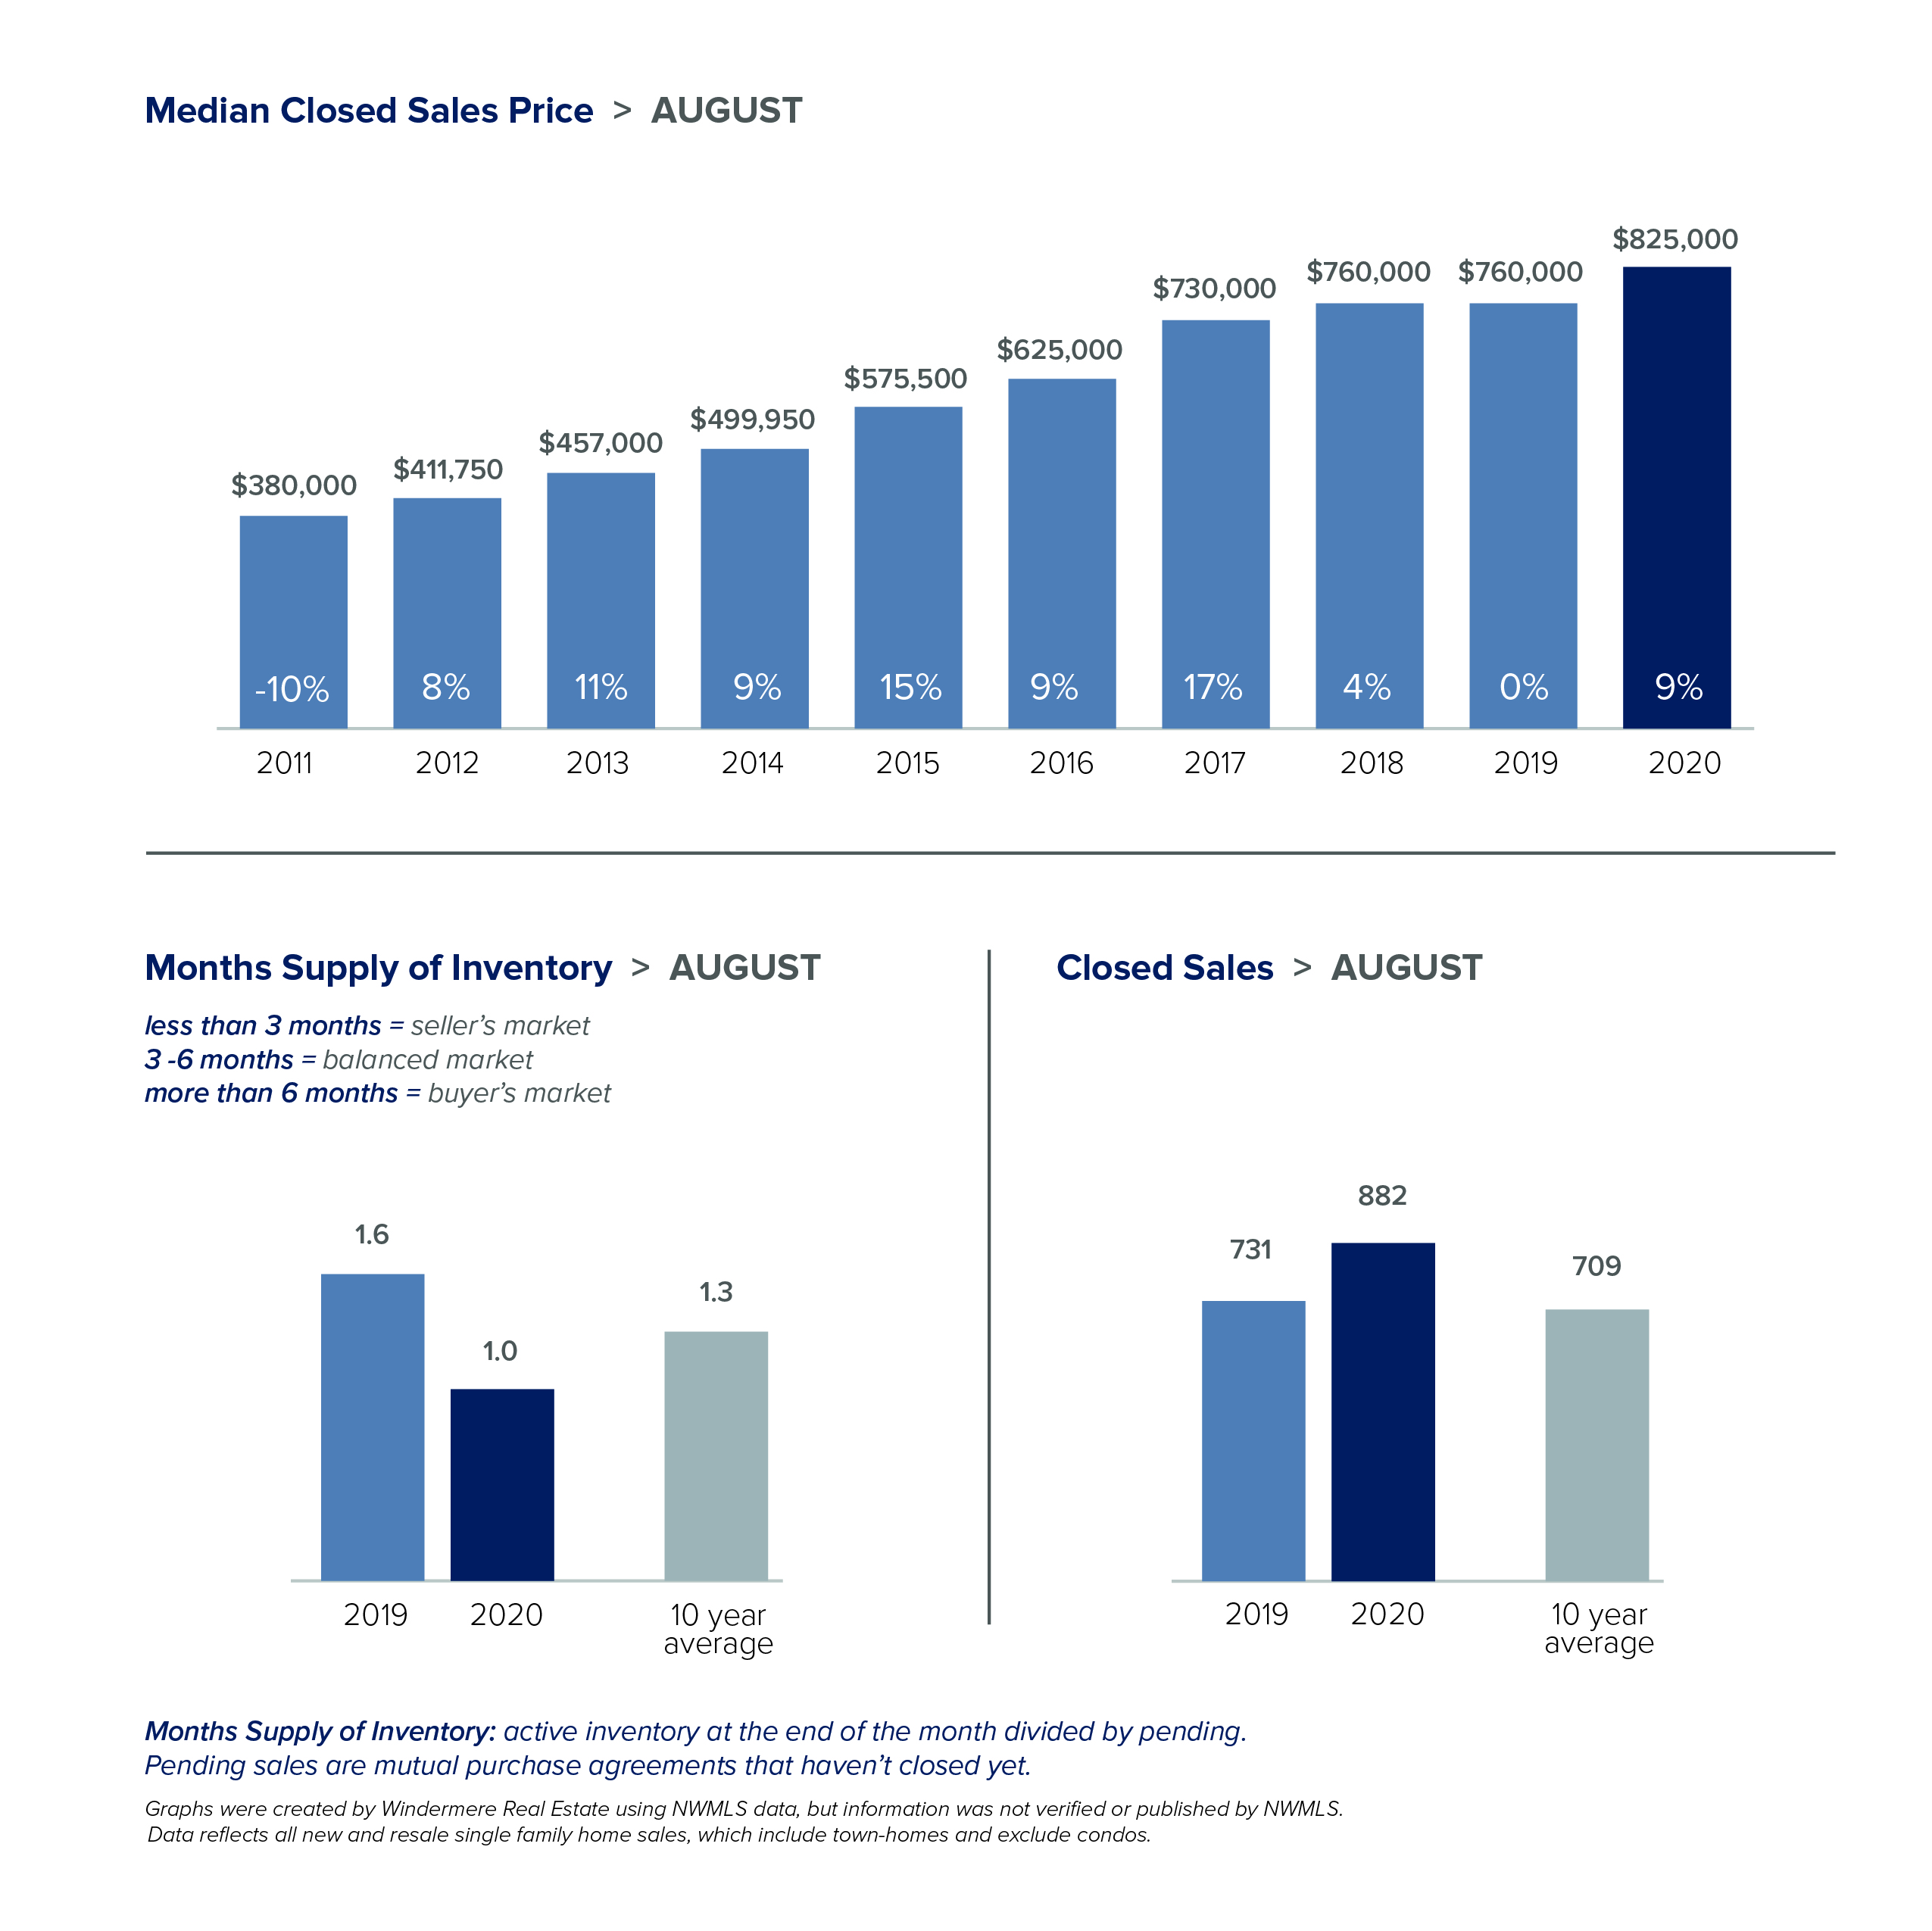
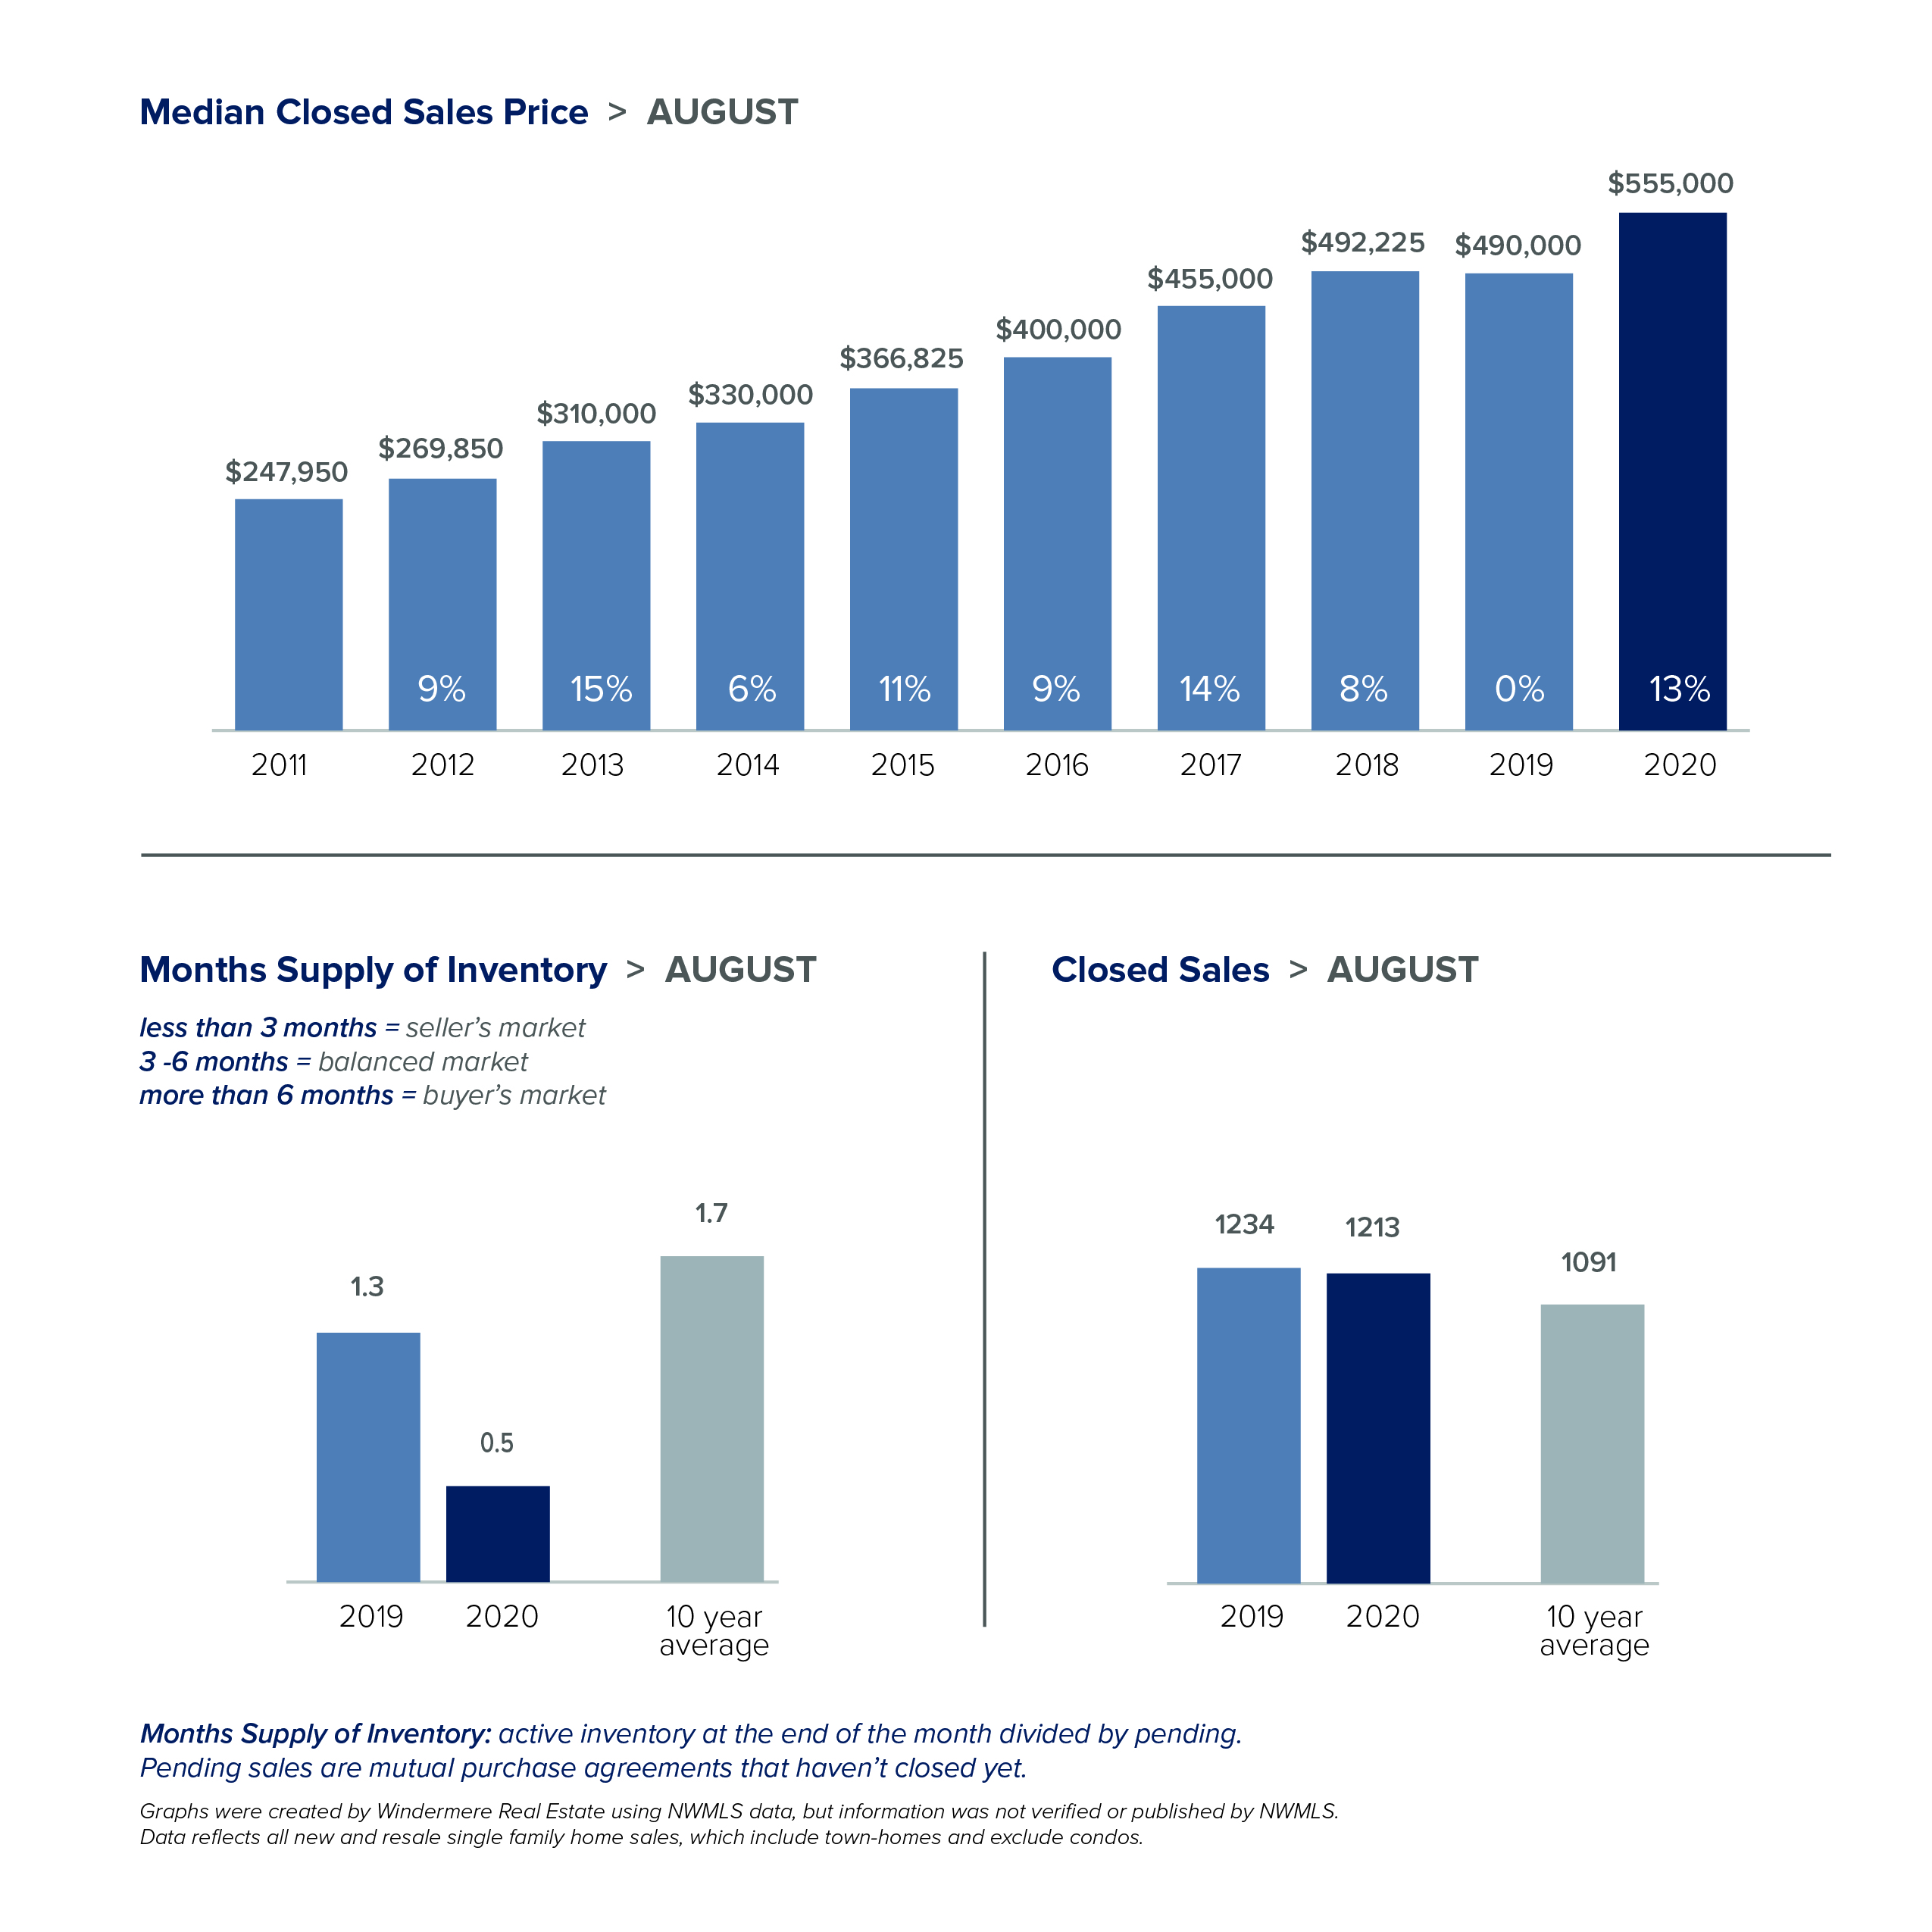
Local Market Update – August 2020

While the pace of daily life may seem slow right now, the
local real estate market has had an unusually busy summer. The number of
new listings in July was up, sales increased, and home prices followed
suit.
• While overall inventory is at historic lows, more sellers put their homes on
the market. New listings of single-family homes in King County jumped more than
25% from a year ago. Snohomish County saw a 7% increase in new listings.
• Pent-up buyer demand fueled sales activity in July. The number of pending
sales was up 17% over a year ago in King County, and up 13% in Snohomish
County.
• With buyers snapping up new listings as soon as they hit the market, total
available inventory dropped to a 10-year low for the month.
• The lack of inventory is benefiting sellers, and multiple offers are now common
at every price point. As a result, single-family home prices rose 7% in King
County and 15% in Snohomish County.
The charts below provide a brief overview of market activity. If you are interested in more information, every Monday Windermere Chief Economist Matthew Gardner provides an update regarding the impact of COVID-19 on the US economy and housing market. You can get Matthew’s latest update here.
EASTSIDE
KING COUNTY
SEATTLE
SNOHOMISH COUNTY
VIEW FULL SNOHOMISH COUNTY REPORT
This post originally appeared on GetTheWReport.com
Local Market Update – June 2020

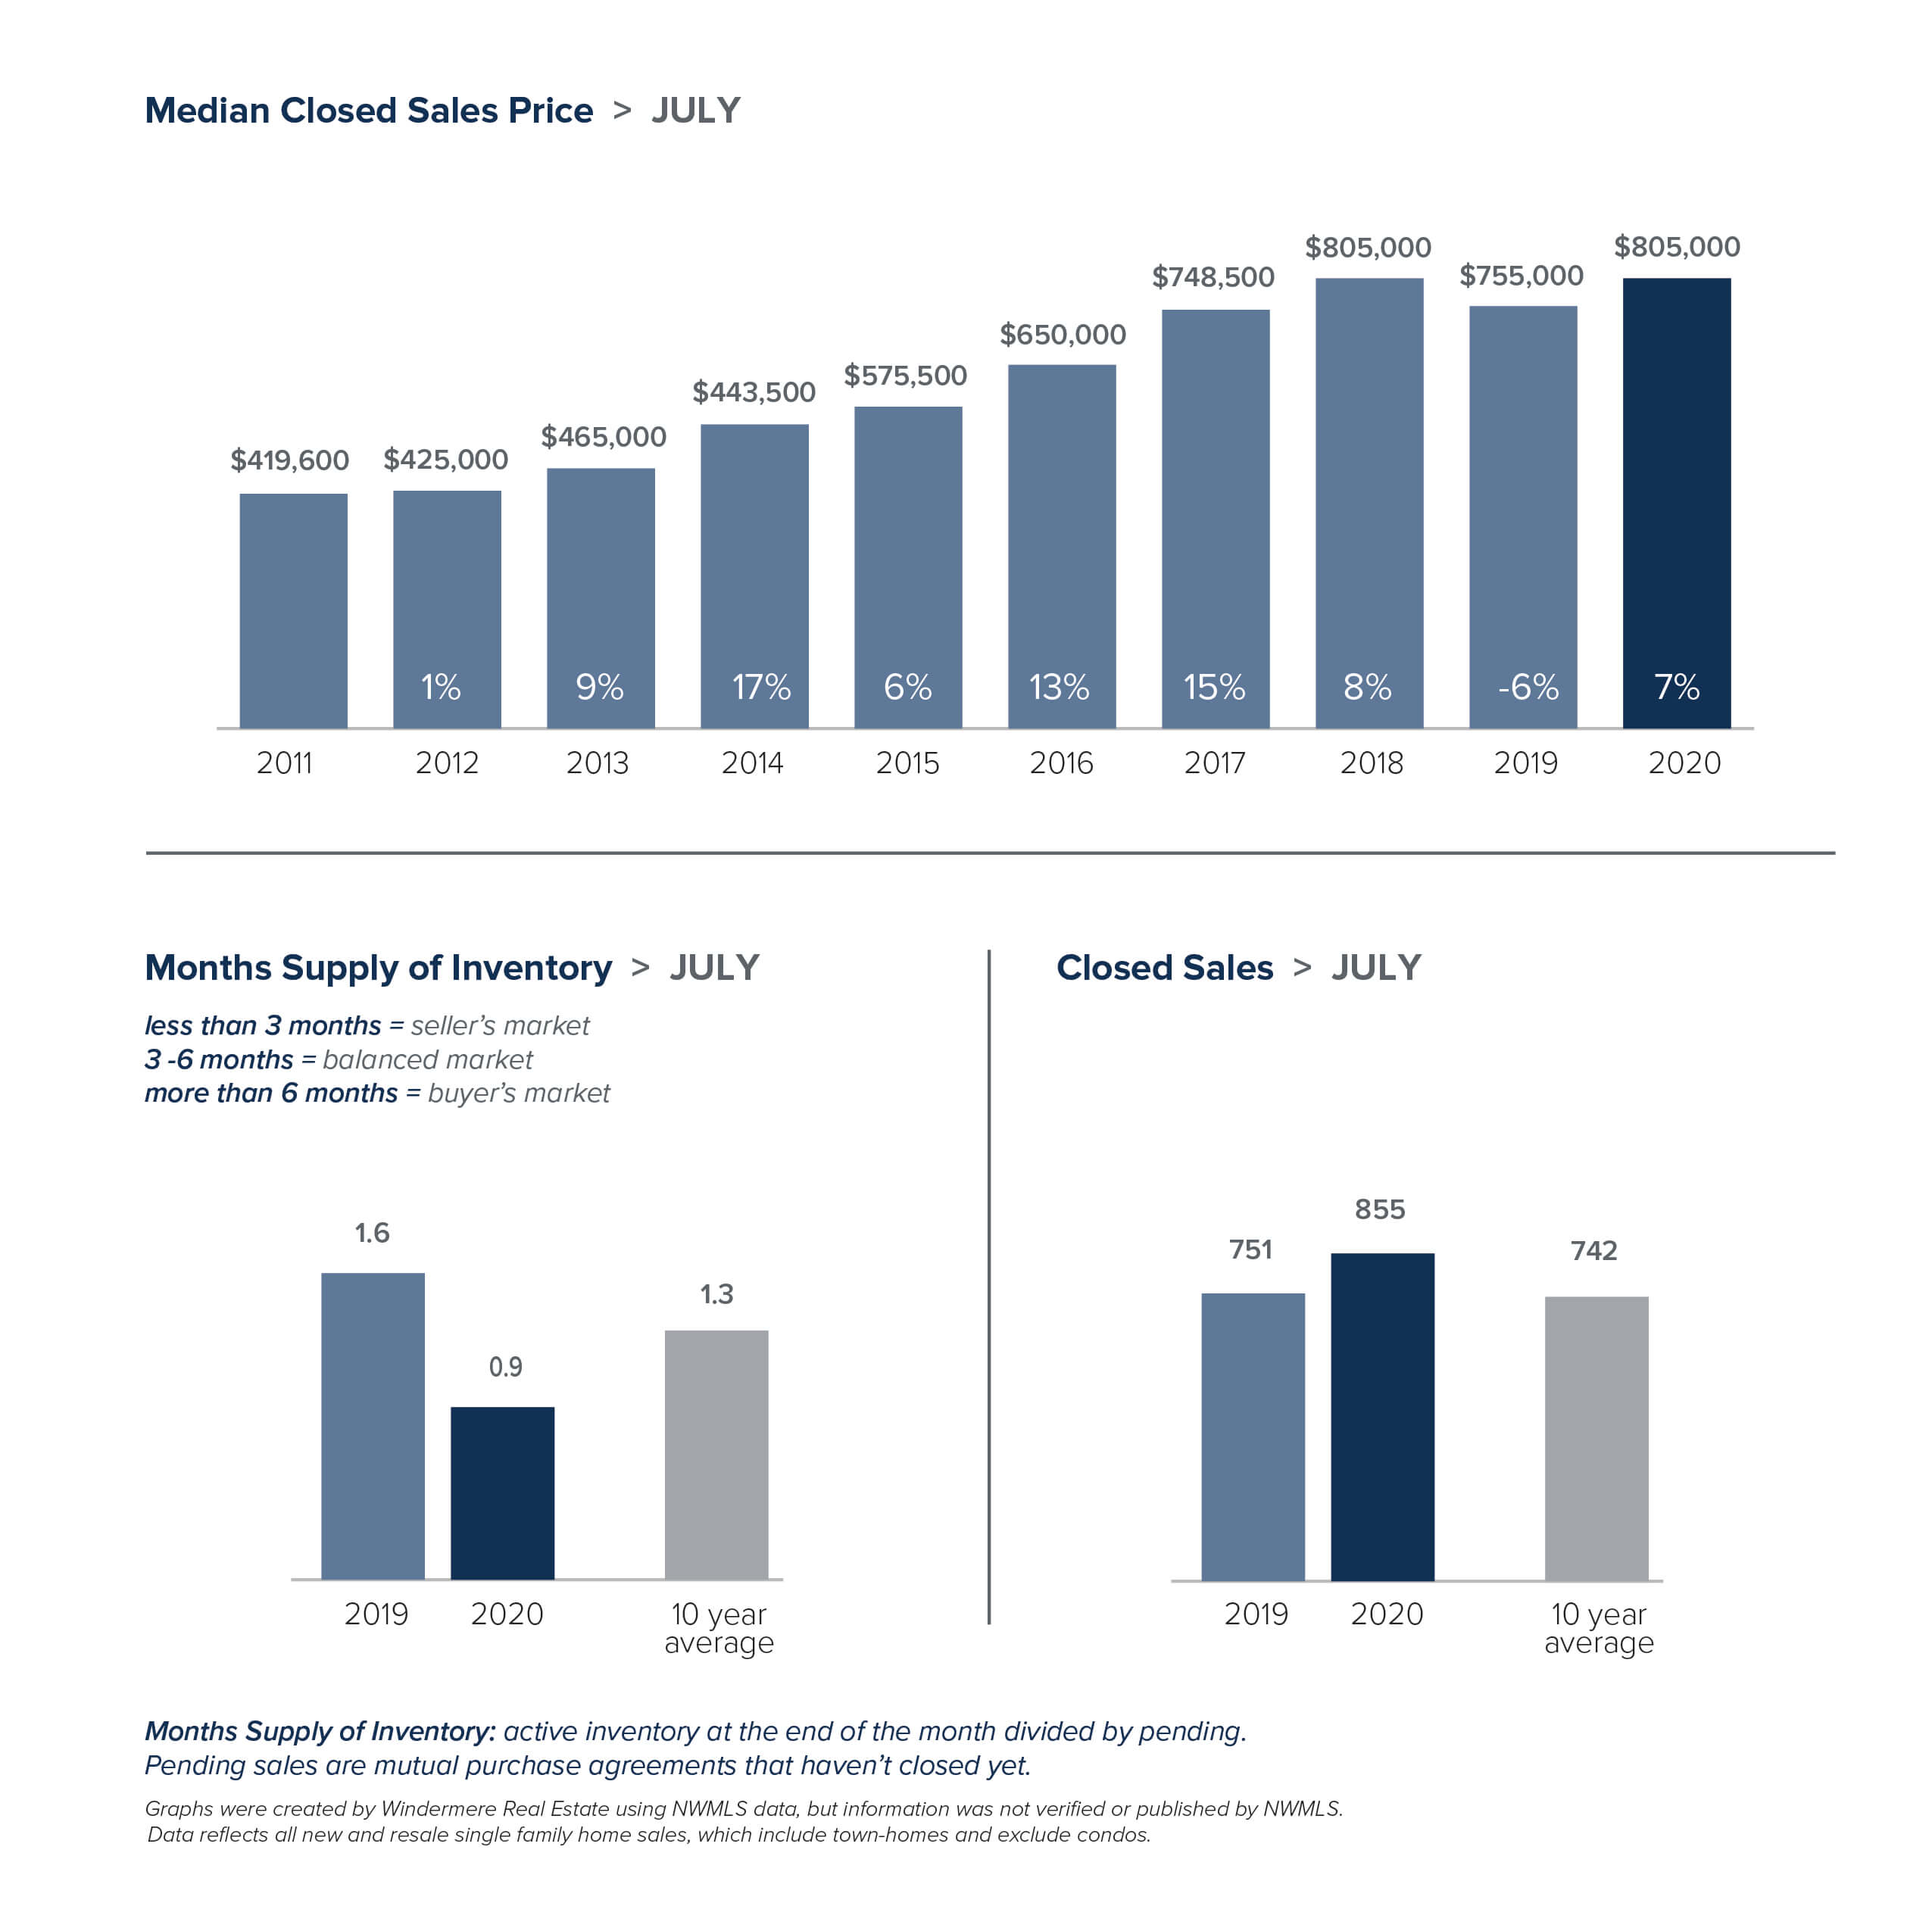
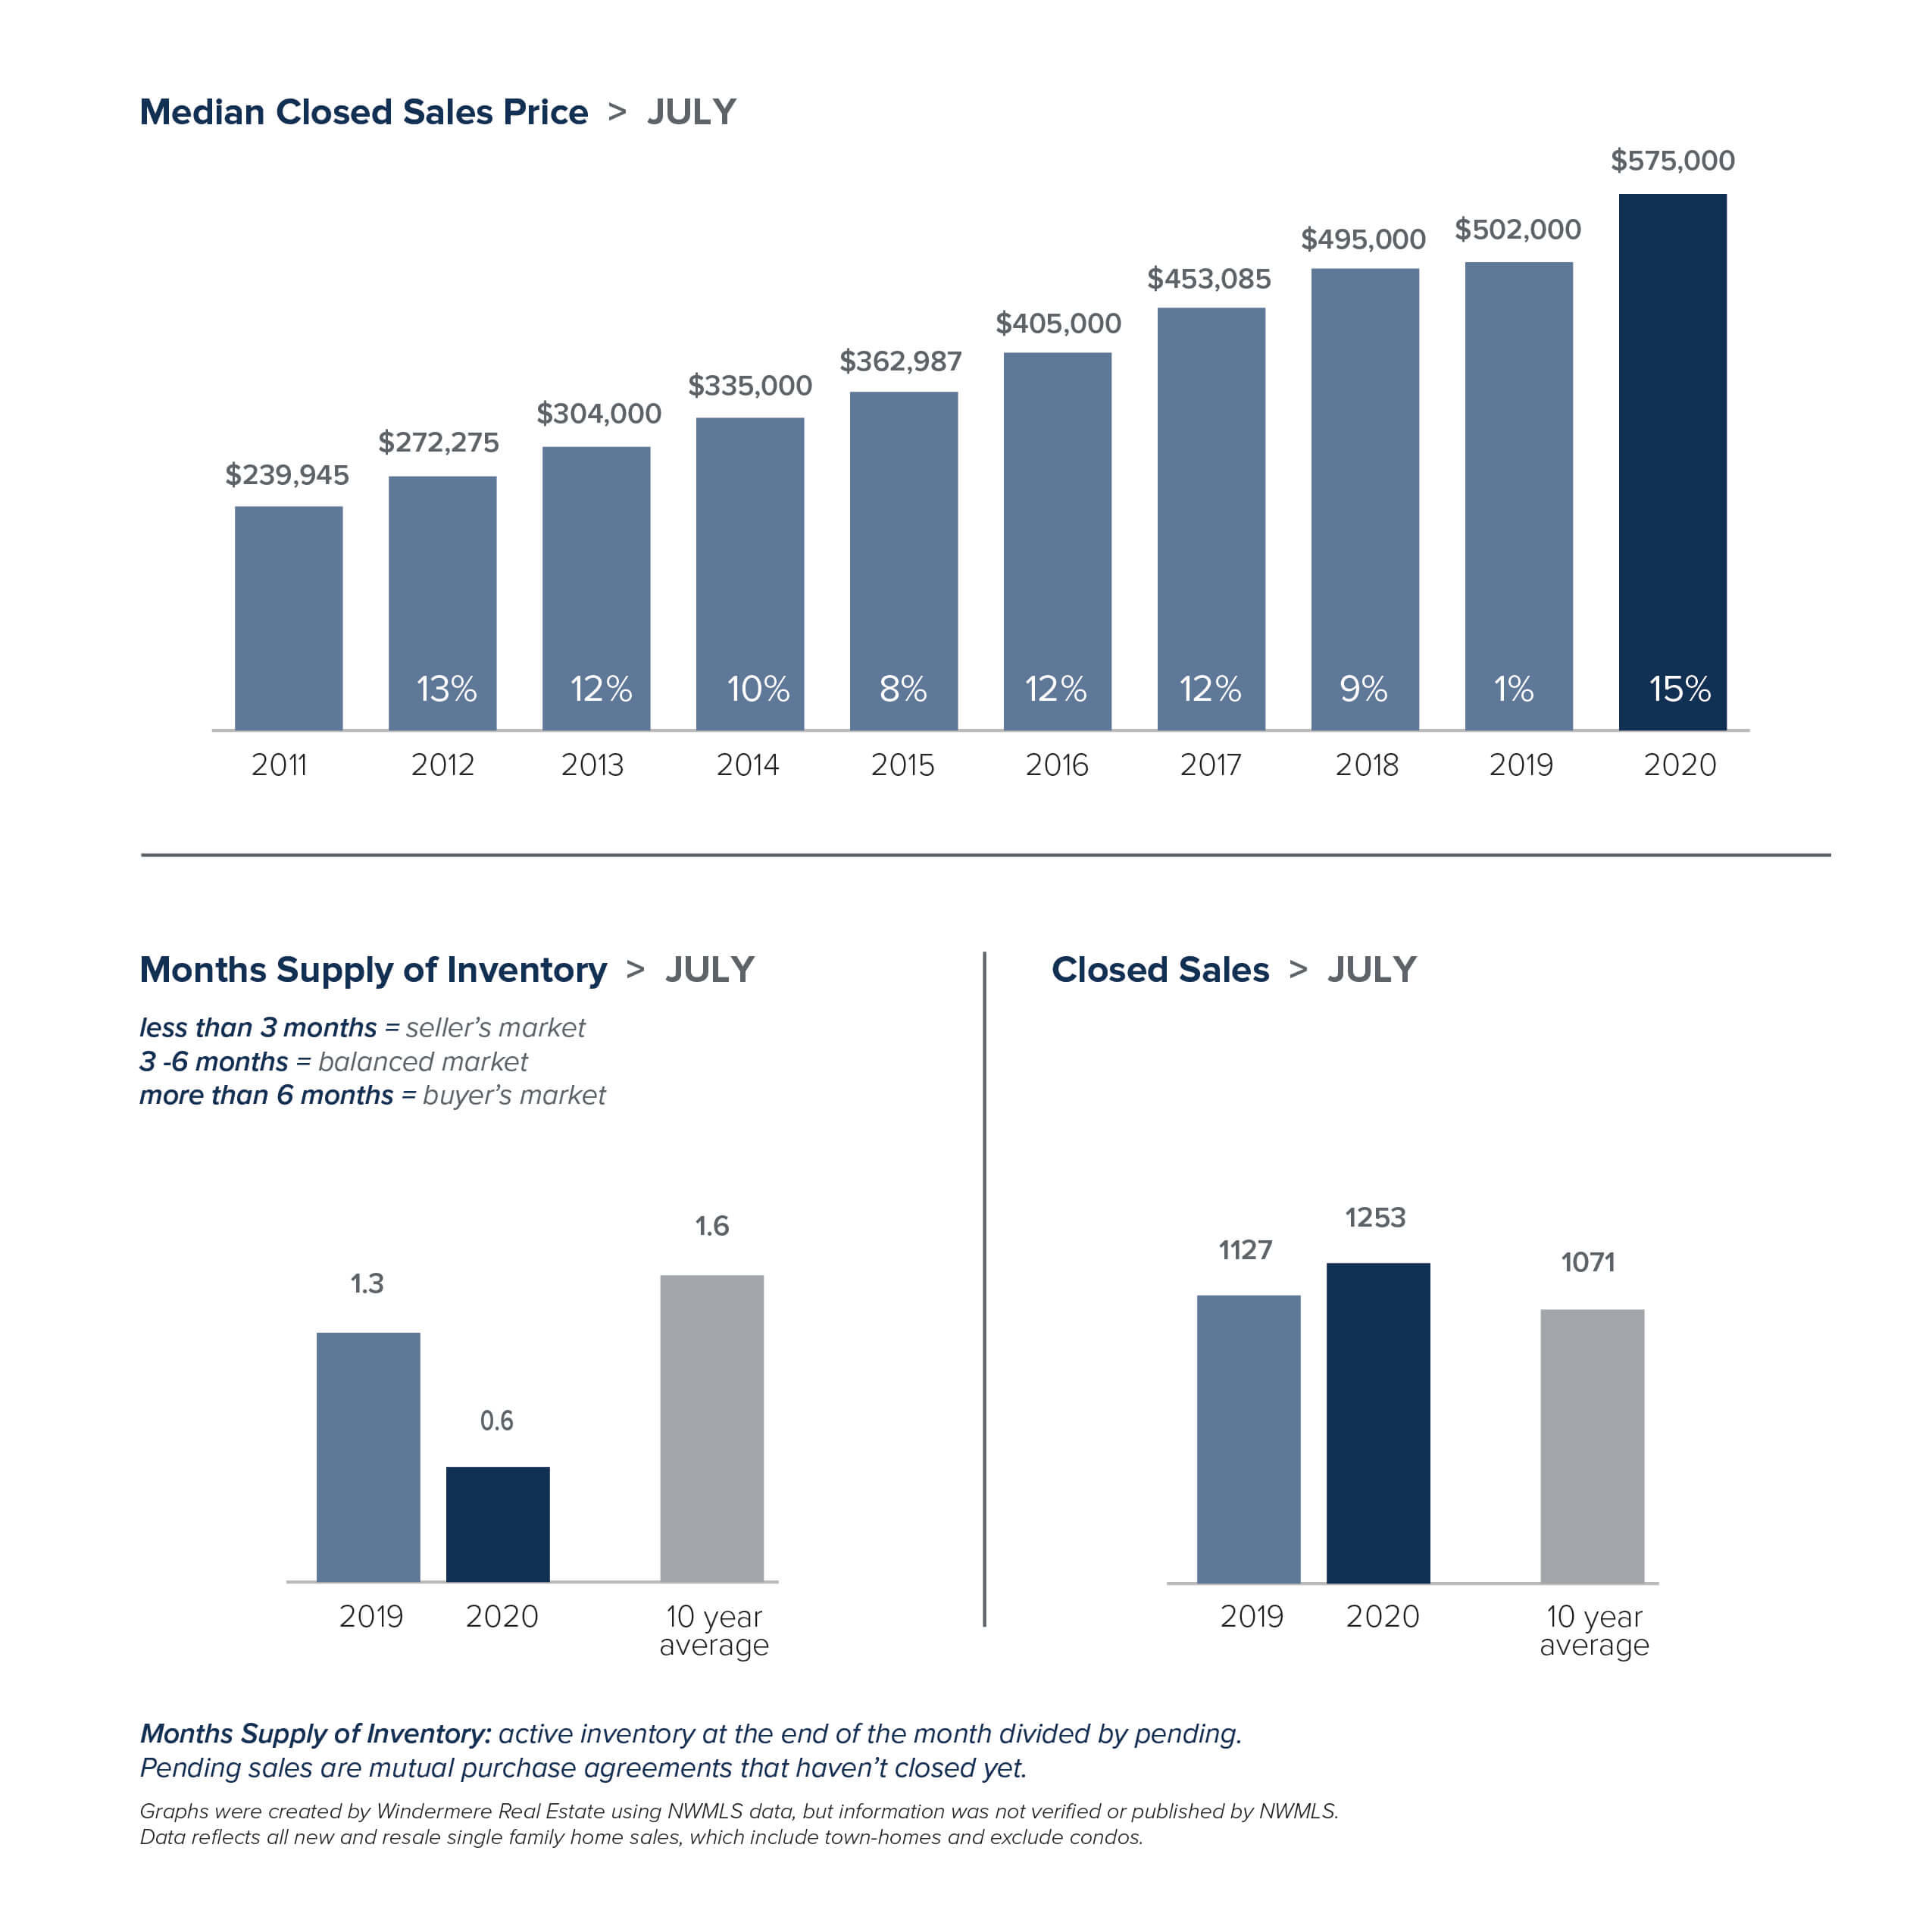
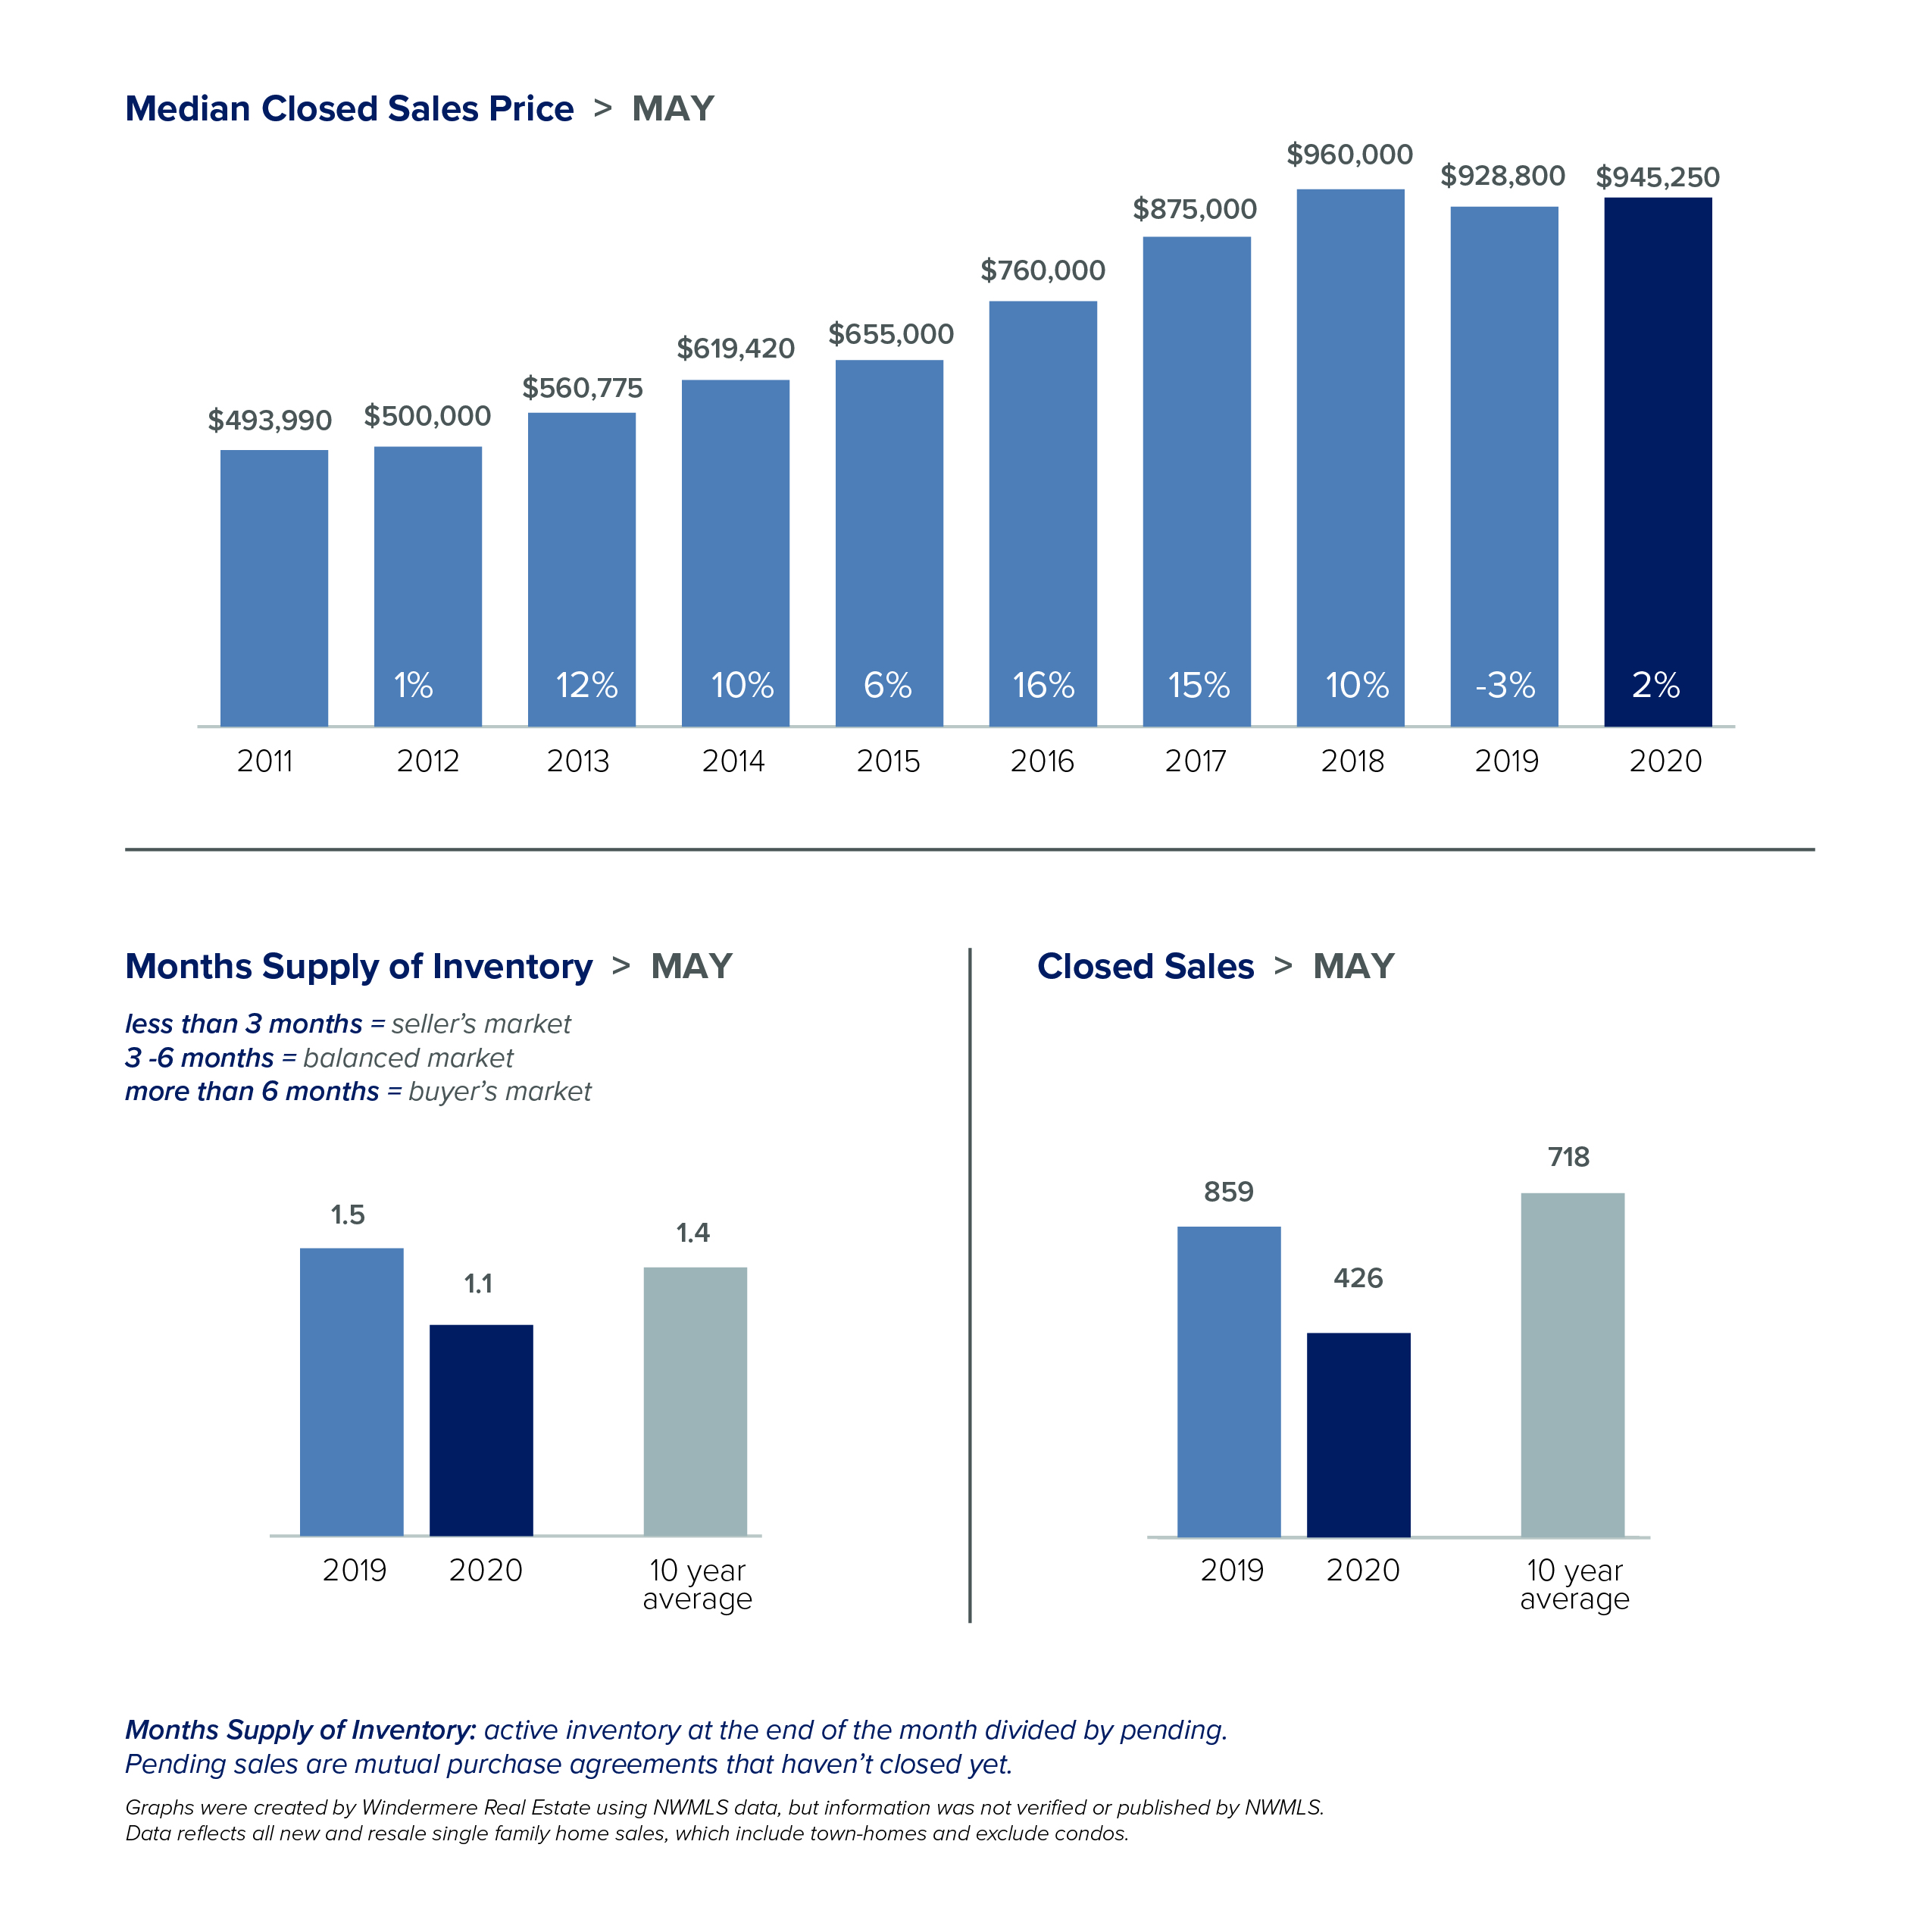
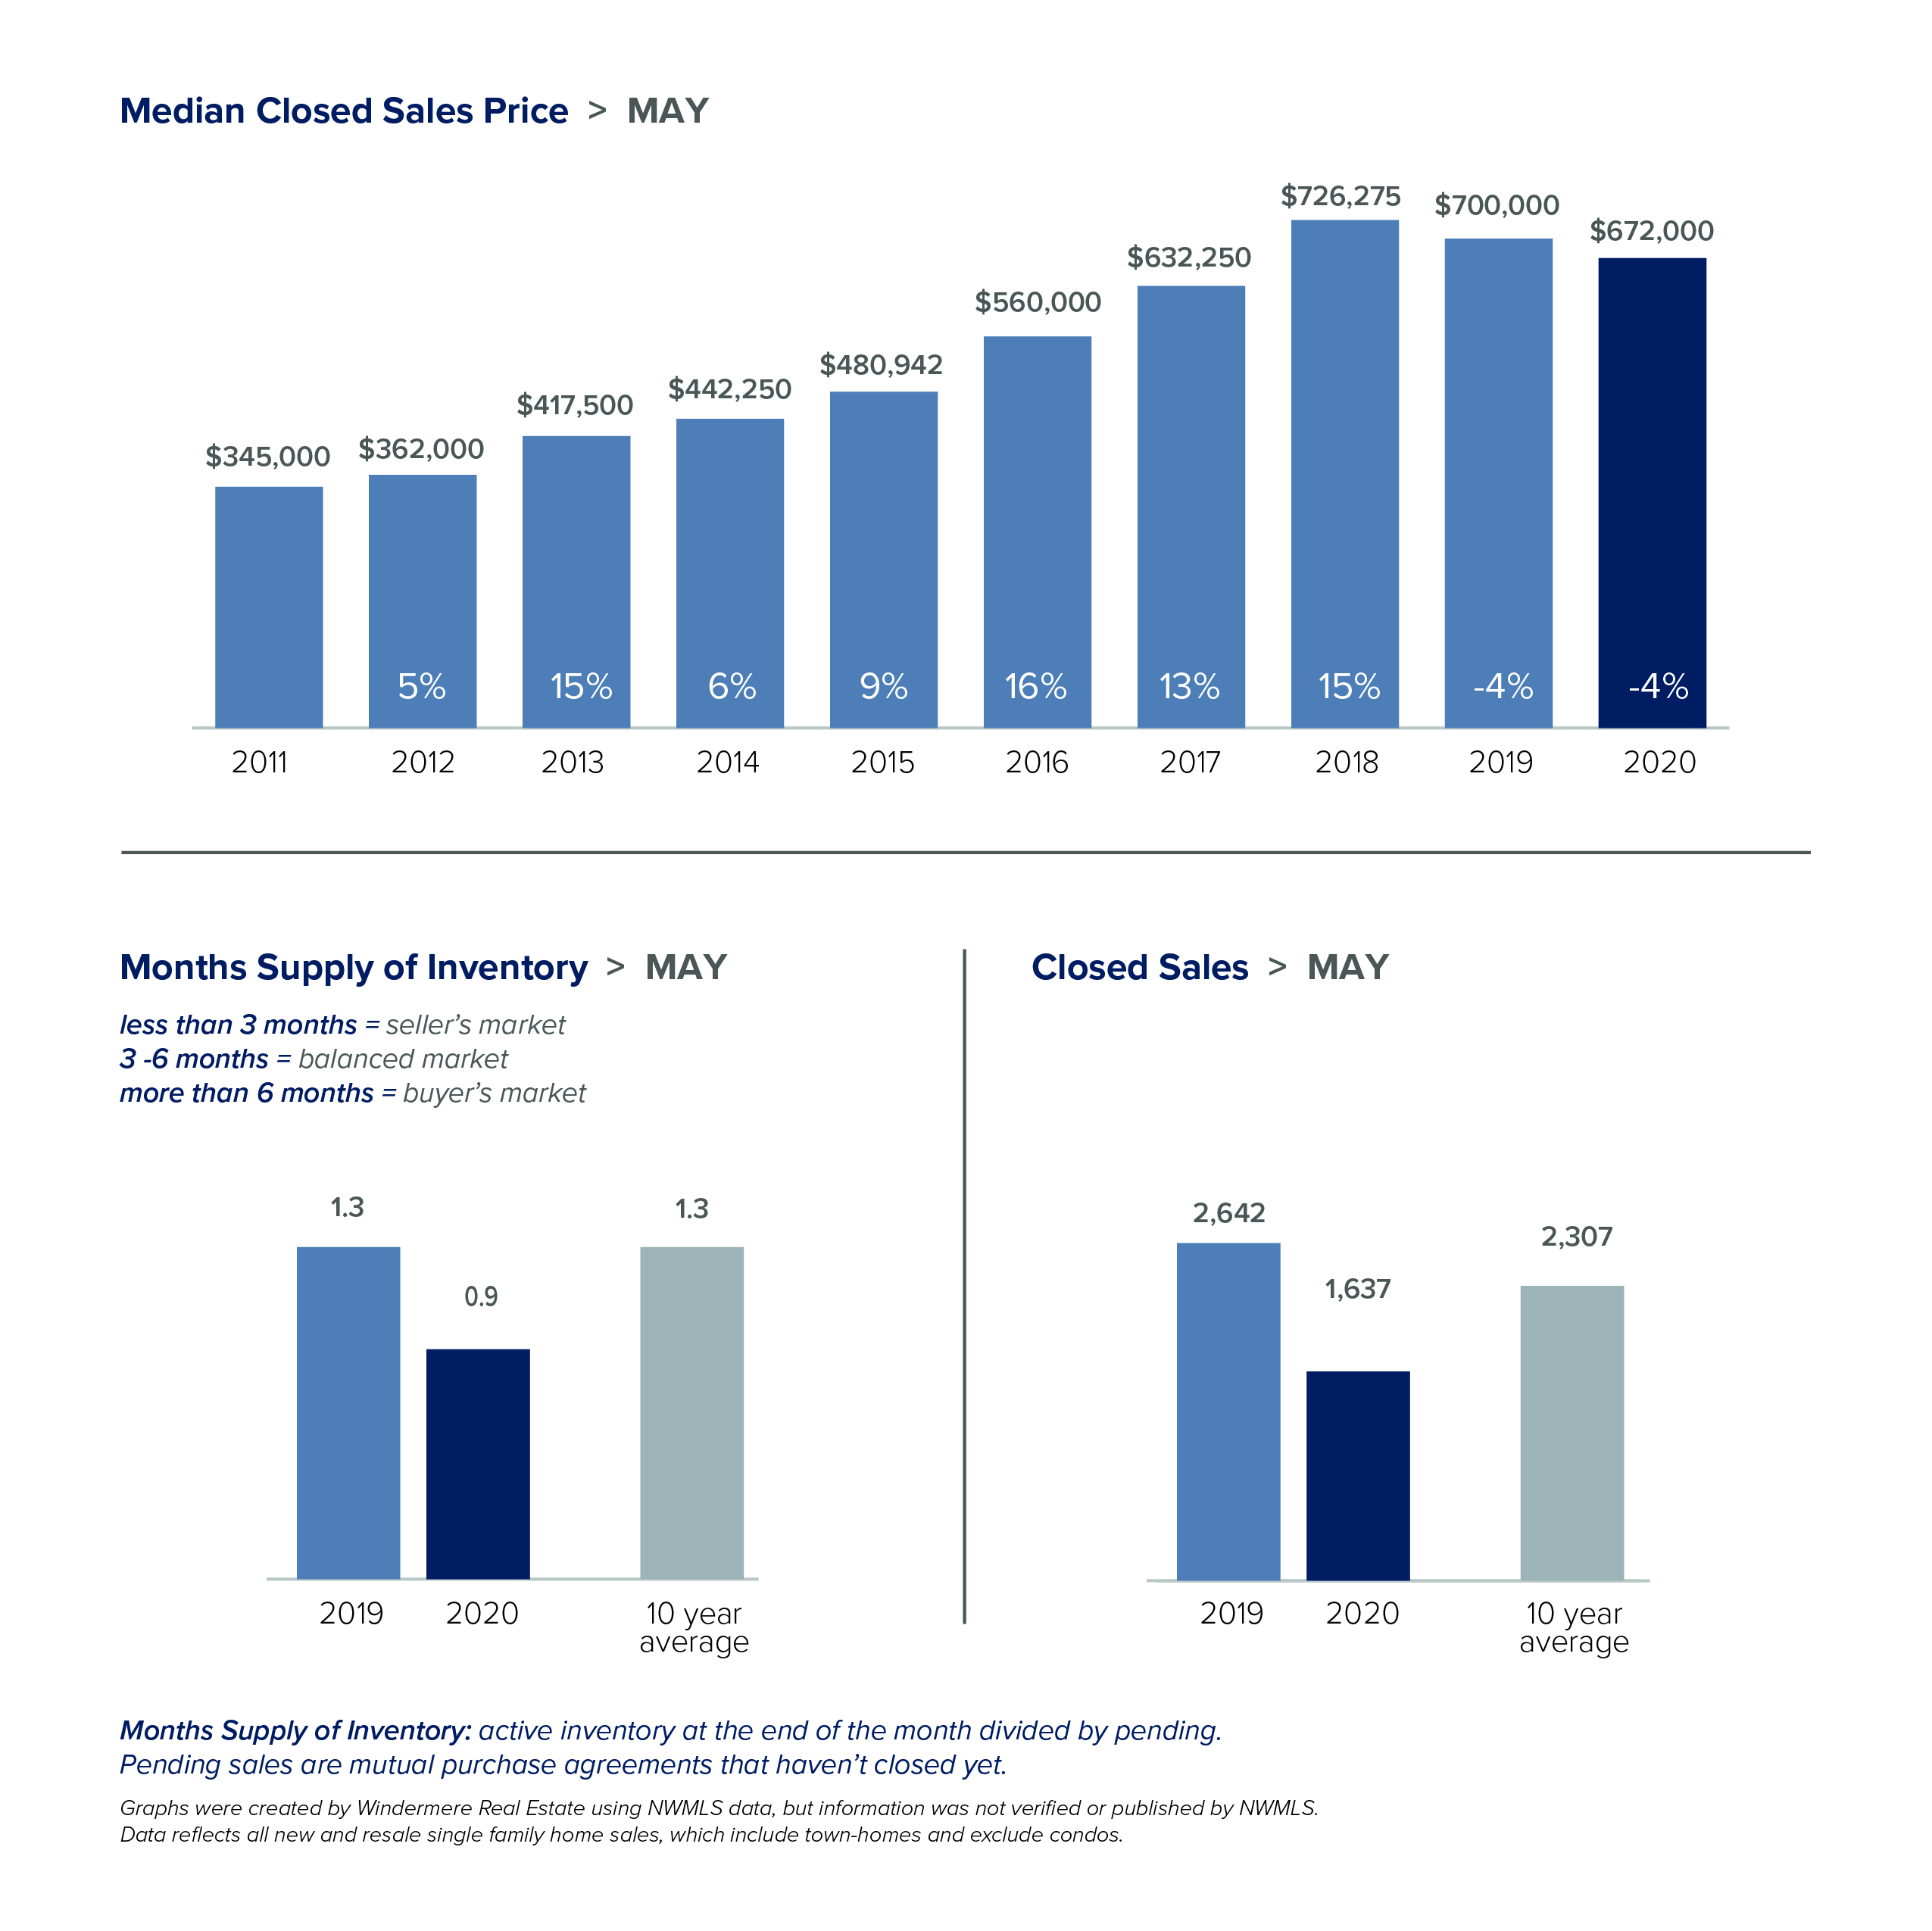
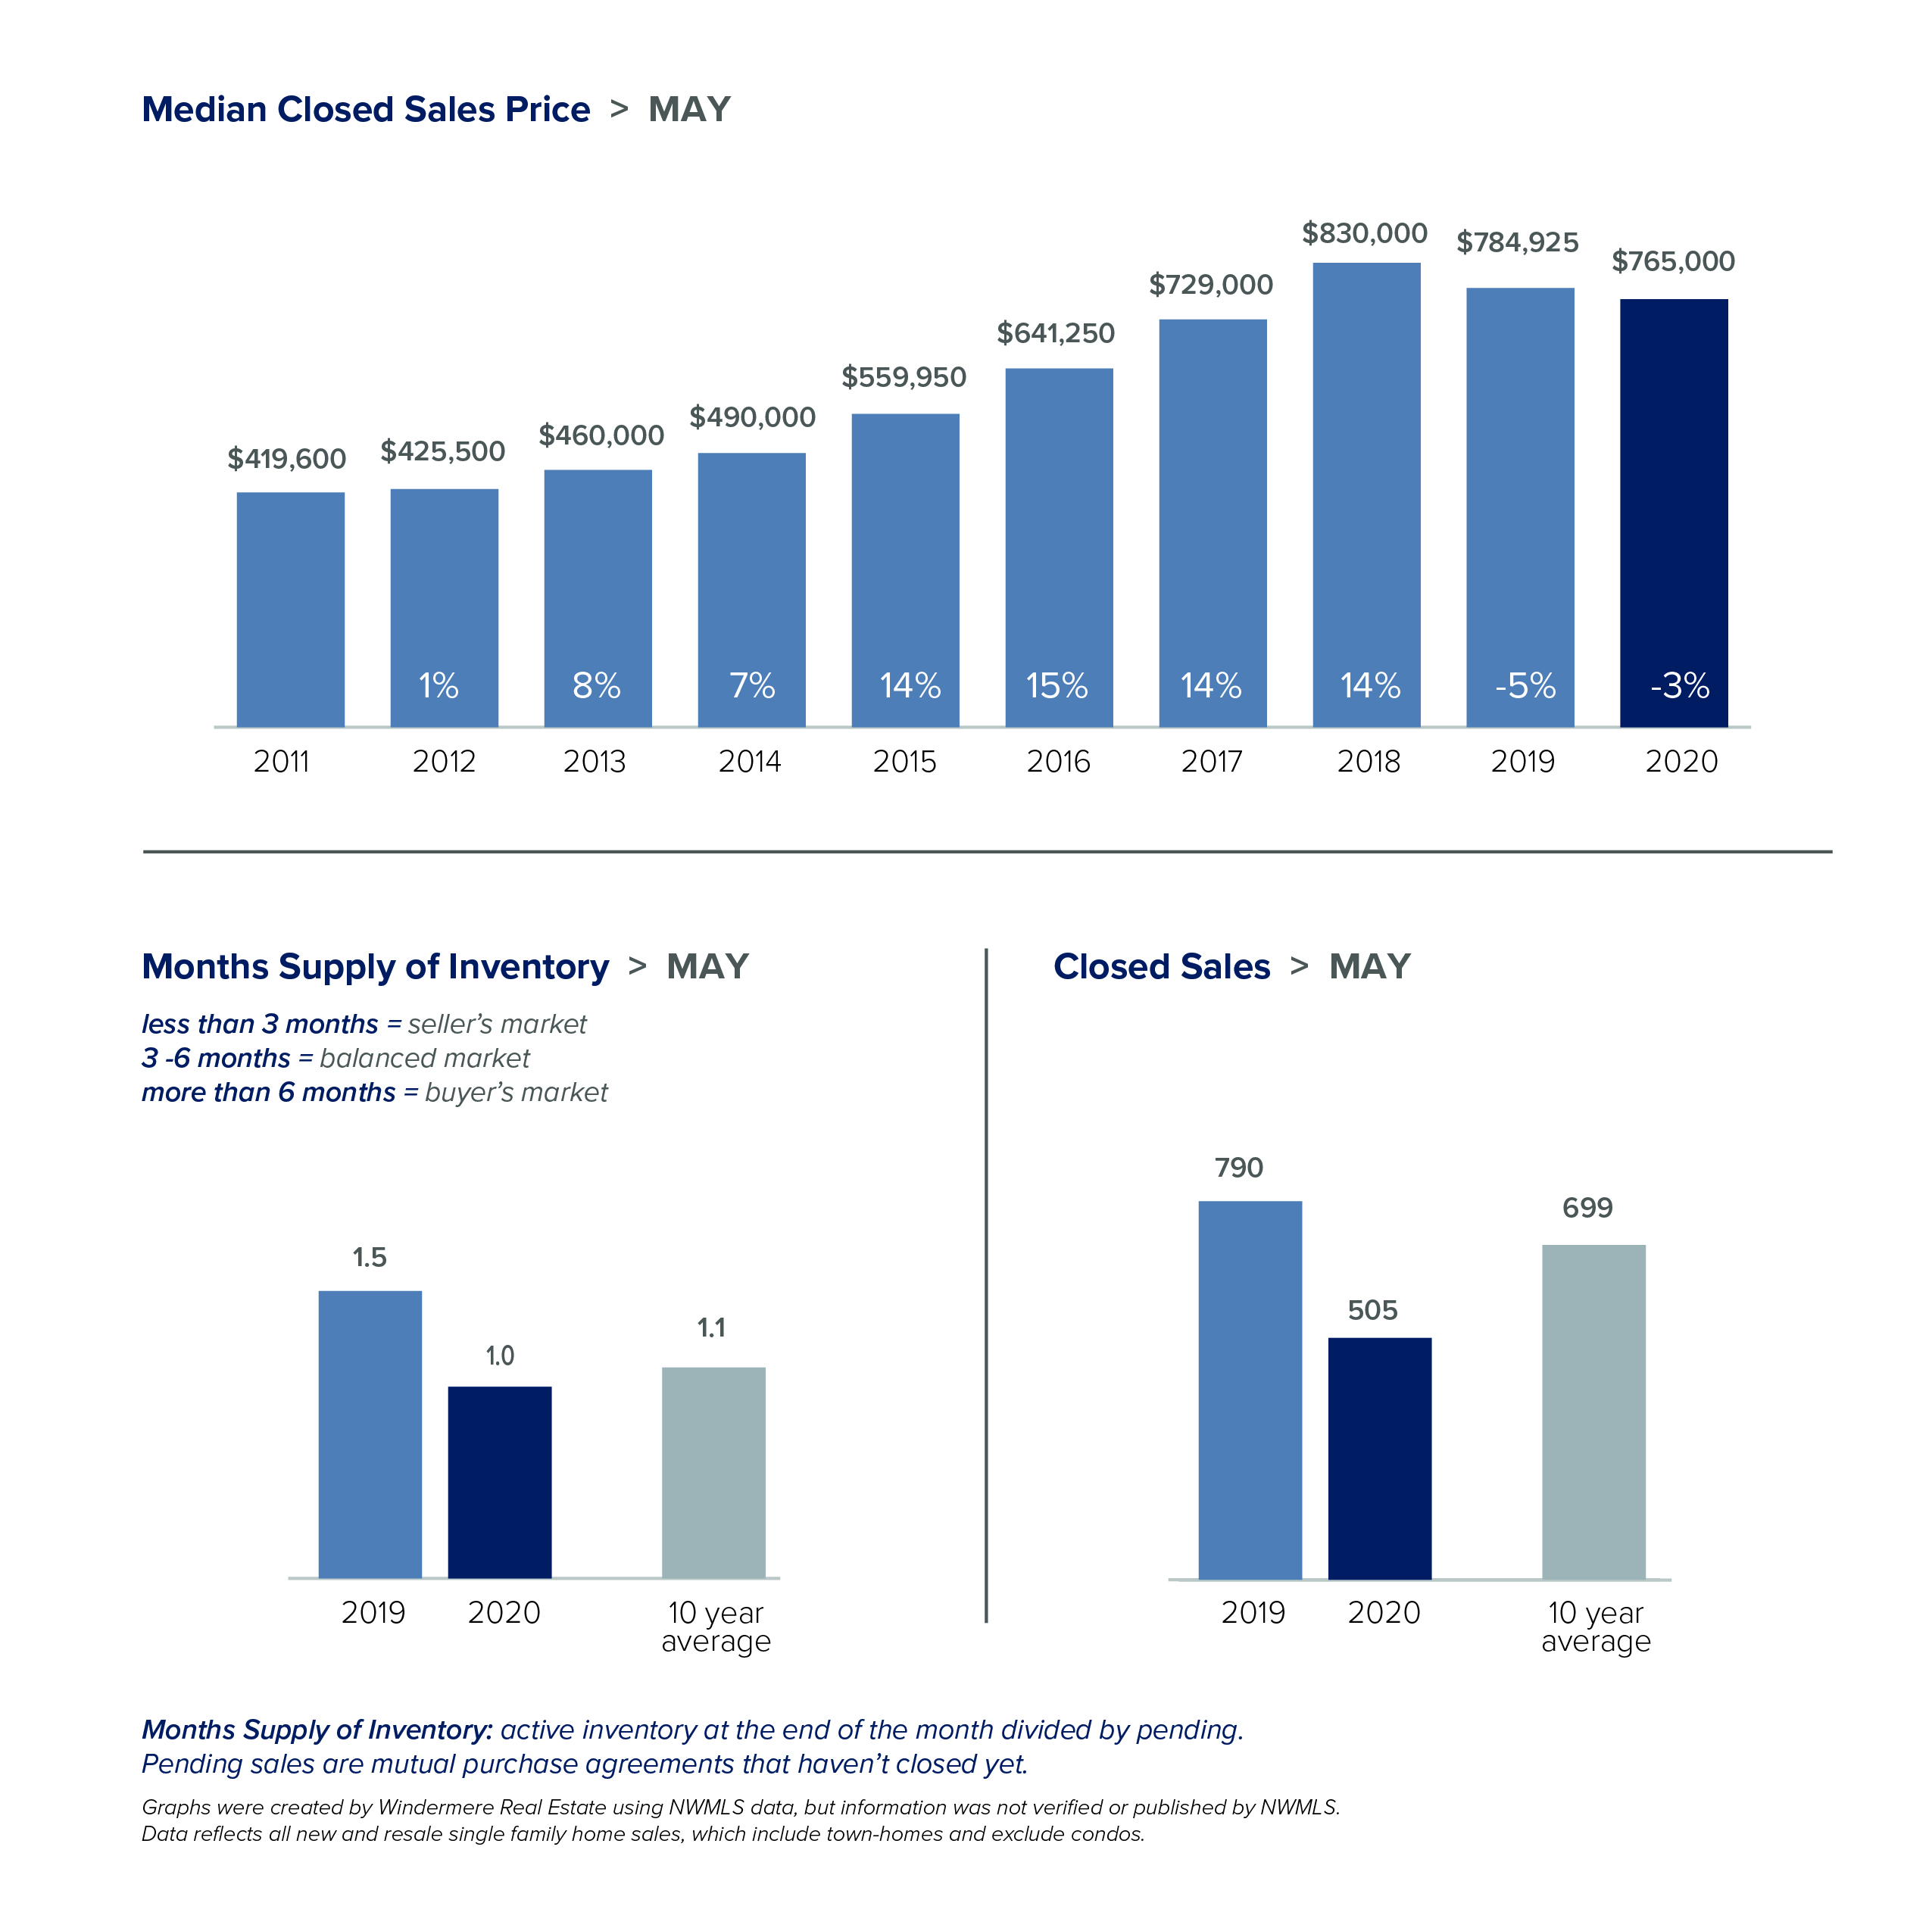
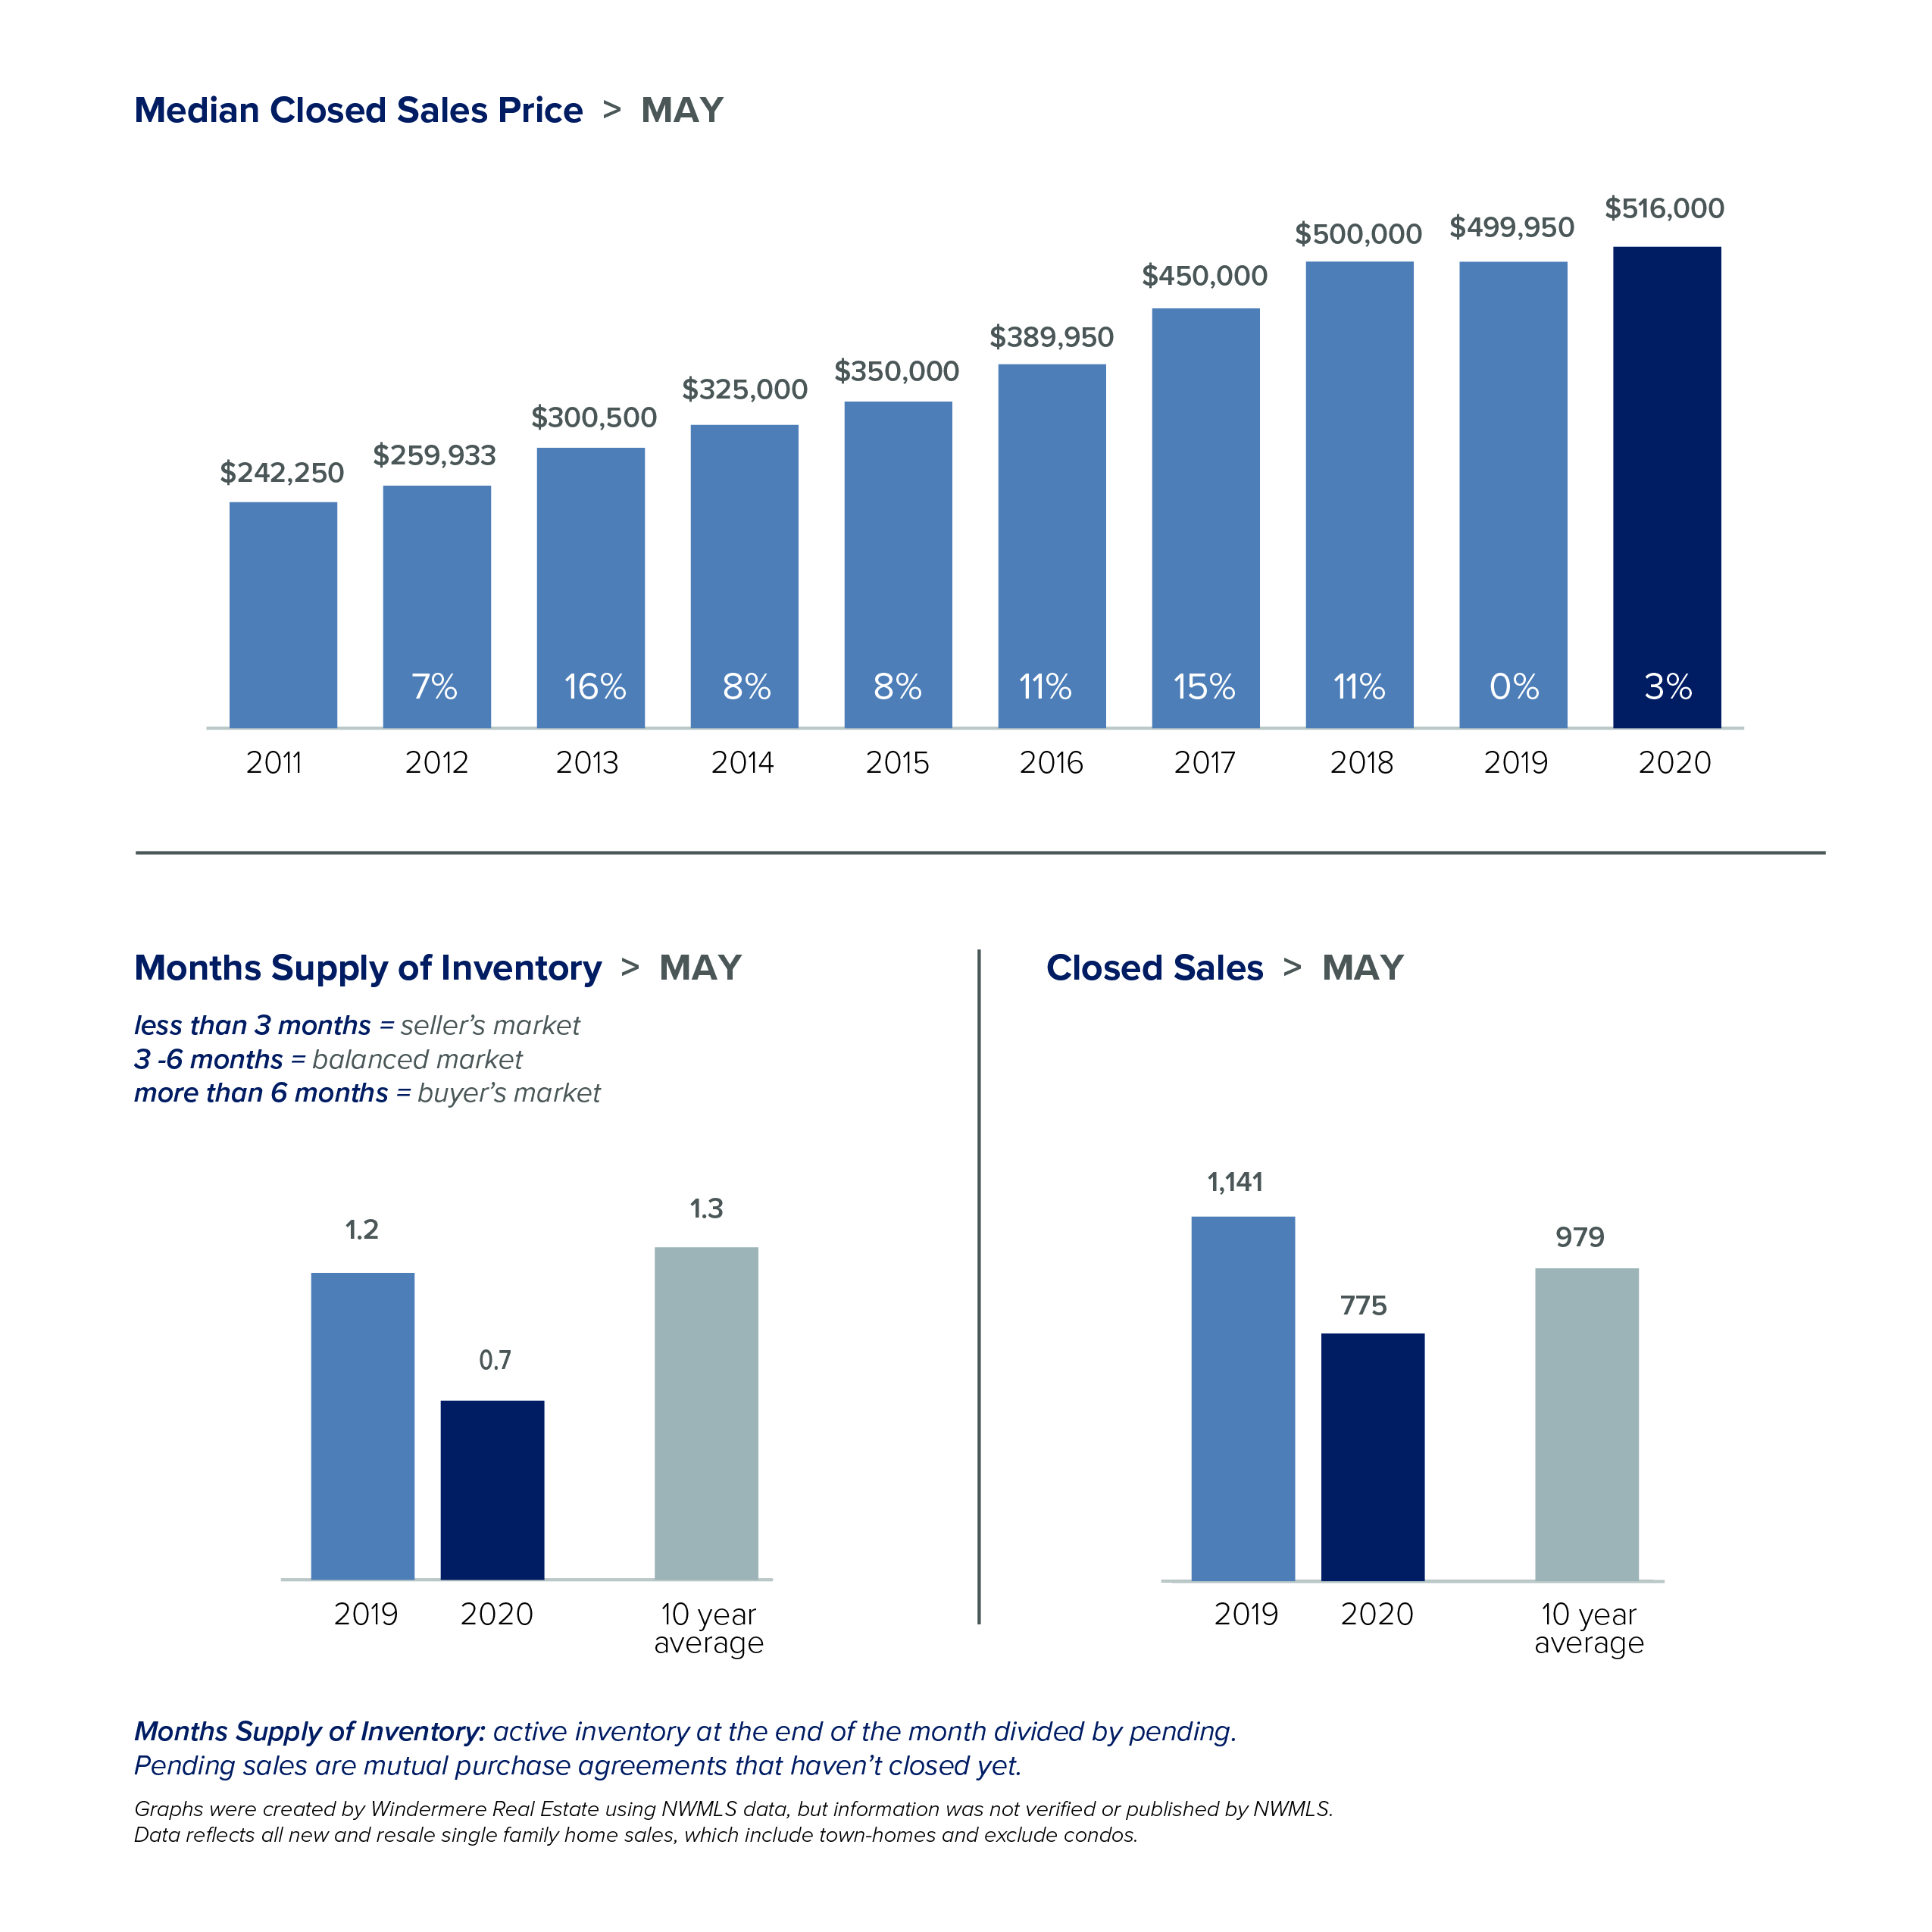
As we move to the next phase of reopening, life feels like it’s slowly inching back towards normal. The same is true in real estate. Statistics on home sales in May provided the first true picture of the effects of COVID-19. Those reports confirmed the incredible strength and stability of the local real estate market.
- The Stay Home order, as expected, continued to impact the number of sales. However, the market is starting to move its way towards more normal activity. Pending sales, a measure of current demand, have risen every week since April.
- The slight drop in median closed sale price is a result of a proportionately larger number of lower priced homes selling than is normal. It should not be interpreted as a decrease in individual home value.
- There were significantly fewer homes for sale in May than the same time last year. With less than a month of available inventory, competition among buyers was intense. Bidding wars and all-cash offers were common.
The monthly statistics below are based on closed sales. Since closing generally takes 30 days, the statistics for May are mostly reflective of sales in April. If you are interested in more information, every Monday Windermere Chief Economist Matthew Gardner provides an update regarding the impact of COVID-19 on the US economy and housing market. You can get Matthew’s latest update here. As we adapt to new phases of reopening, know that the safety of everyone remains our top priority.
EASTSIDE
KING COUNTY
SEATTLE
SNOHOMISH COUNTY
VIEW FULL SNOHOMISH COUNTY REPORT
This post originally appeared on GetTheWReport.com
